Lexar NM800Pro
Basic Information
In this report, we test Lexar NM800Pro, Kingston, and Lenovo Y9000.
| Model Name | Firmware Version | |
|---|---|---|
| NM800Pro | Lexar 1TB SSD | 3.7.F.V |
| Y9000 | Lenovo Y9000 SSD-M.2-2280s-NVMe-1T | EIFM31.4 |
| KC3000 | KINGSTON SKC3000S1024G | EIFK31.6 |
Latency
We still check their IO latency first.
Max Write Latency
| 10 IOPS (ms) | 4K 1QD (ms) | 512B 1QD 10p filled (ms) | 512B 1QD 50% filled (ms) | 4K mix RW 90% filled (ms) | |
|---|---|---|---|---|---|
| NM800Pro | 169.518 | 269.942 | 269.673 | 280.994 | 398.688 |
| Y9000 | 220.782 | 265.775 | 8.514 | 8.982 | 15.466 |
| KC3000 | 7.398 | 8.485 | 6.473 | 6.351 | 15.375 |
NM800Pro’s max latency is high in all workload.
Speed
Sequential Write
| 10% filled (MB/s) | 90% filled (MB/s) | 50% trimmed (MB/s) | |
|---|---|---|---|
| NM800Pro | 5326.648 | 1302.432 | 3476.630 |
| Y9000 | 4217.862 | 1748.675 | 3431.828 |
| KC3000 | 5434.081 | 1937.452 | 3420.778 |
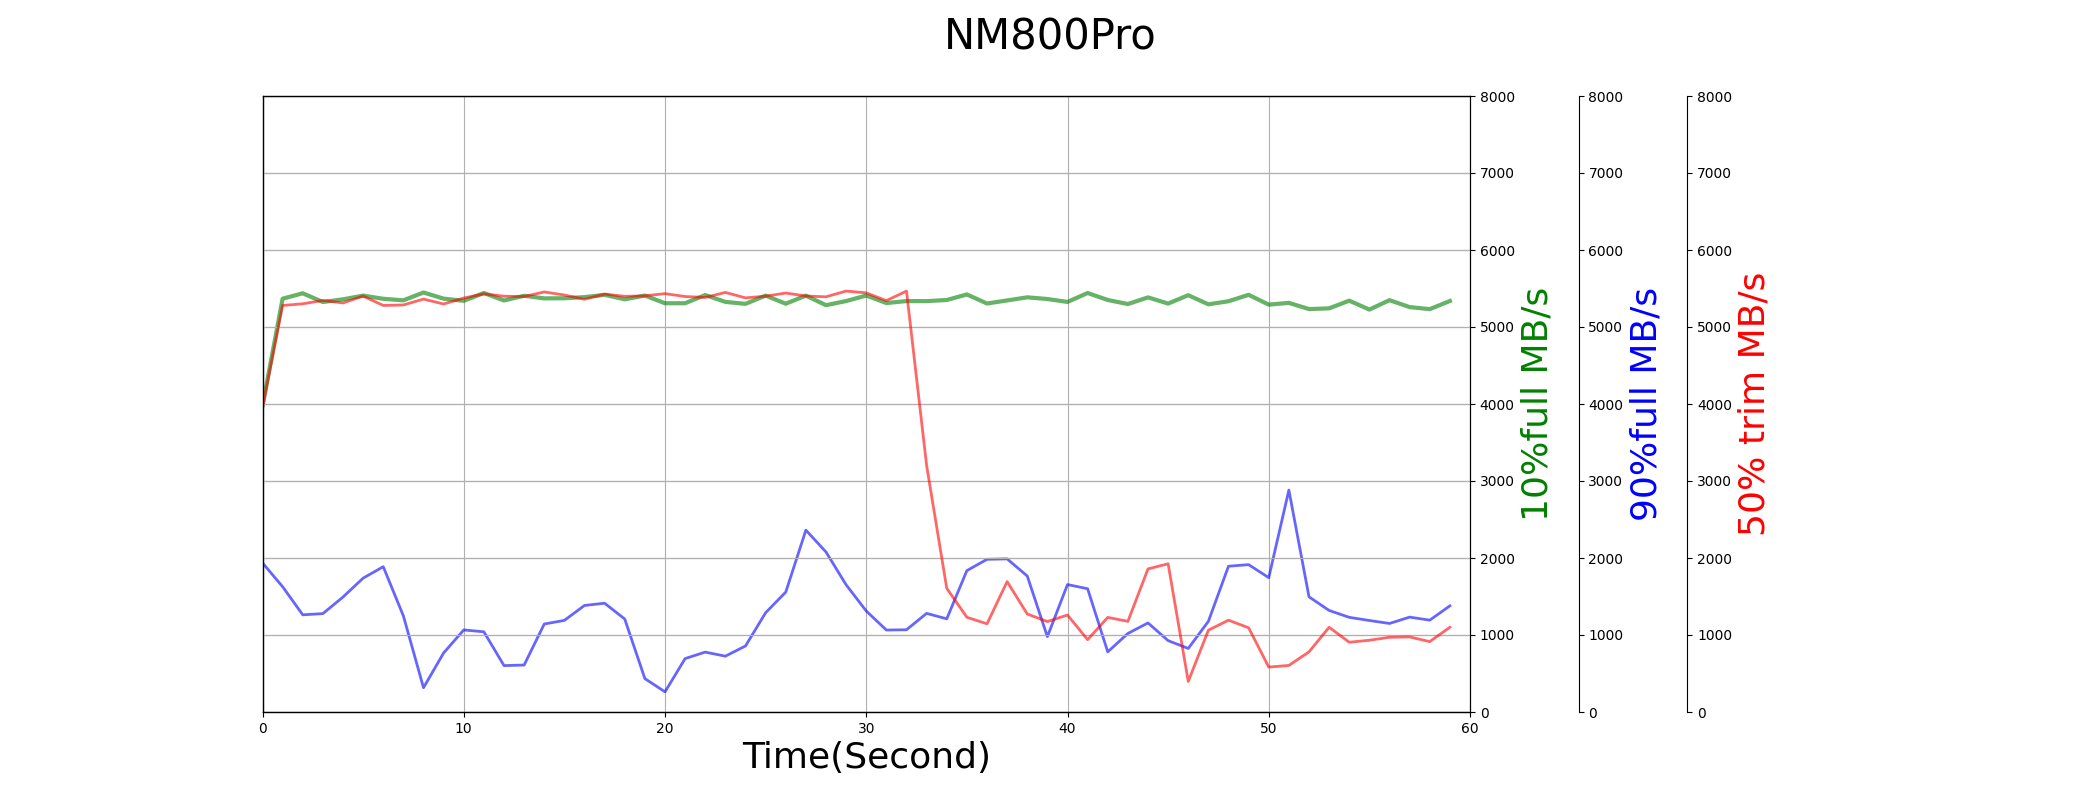
All drives have good and similar sequential write performance. The performance all degrade when drives are full filled, and recover after trim operations.
NM800Pro write performance is stable when the drive is empty.
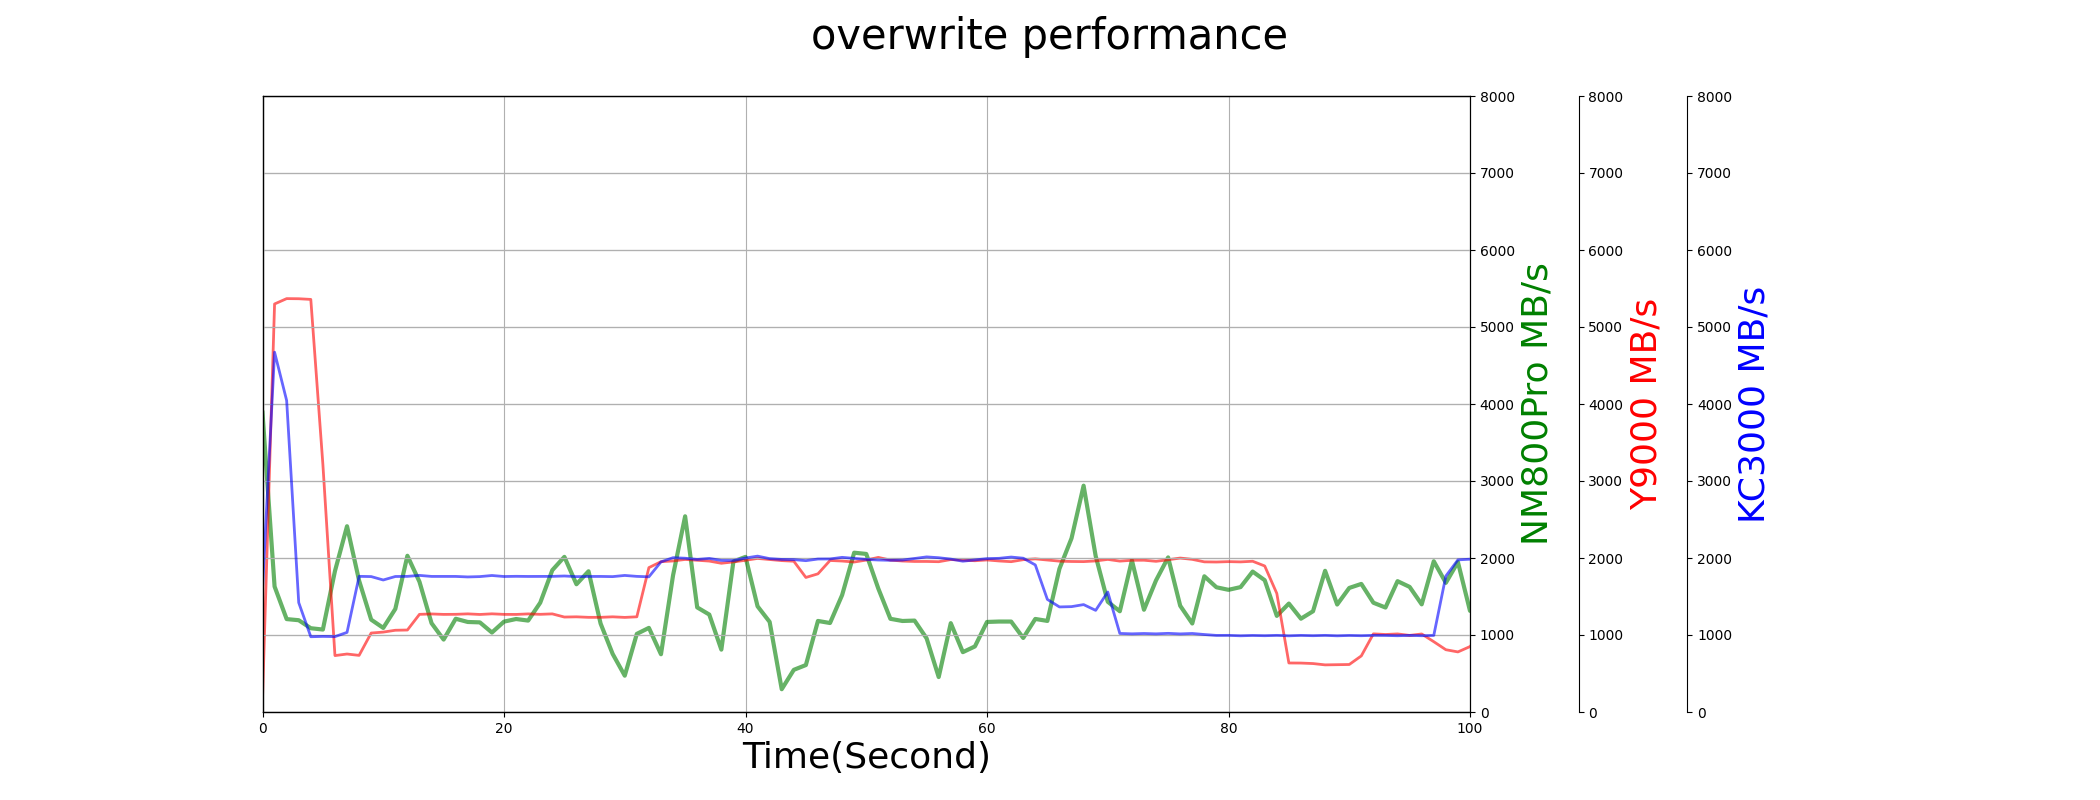
Random Write
| 10% filled (K IOPS) | 90% filled (K IOPS) | 50% trimmed (K IOPS) | 50% trimmed IOPS consistency | |
|---|---|---|---|---|
| NM800Pro | 258.312 | 195.890 | 200.432 | 0.04 |
| Y9000 | 296.407 | 195.651 | 219.502 | 0.68 |
| KC3000 | 264.605 | 218.042 | 236.009 | 0.56 |
| 9A3 | 684.982 | 604.416 | 684.971 | 0.99 |
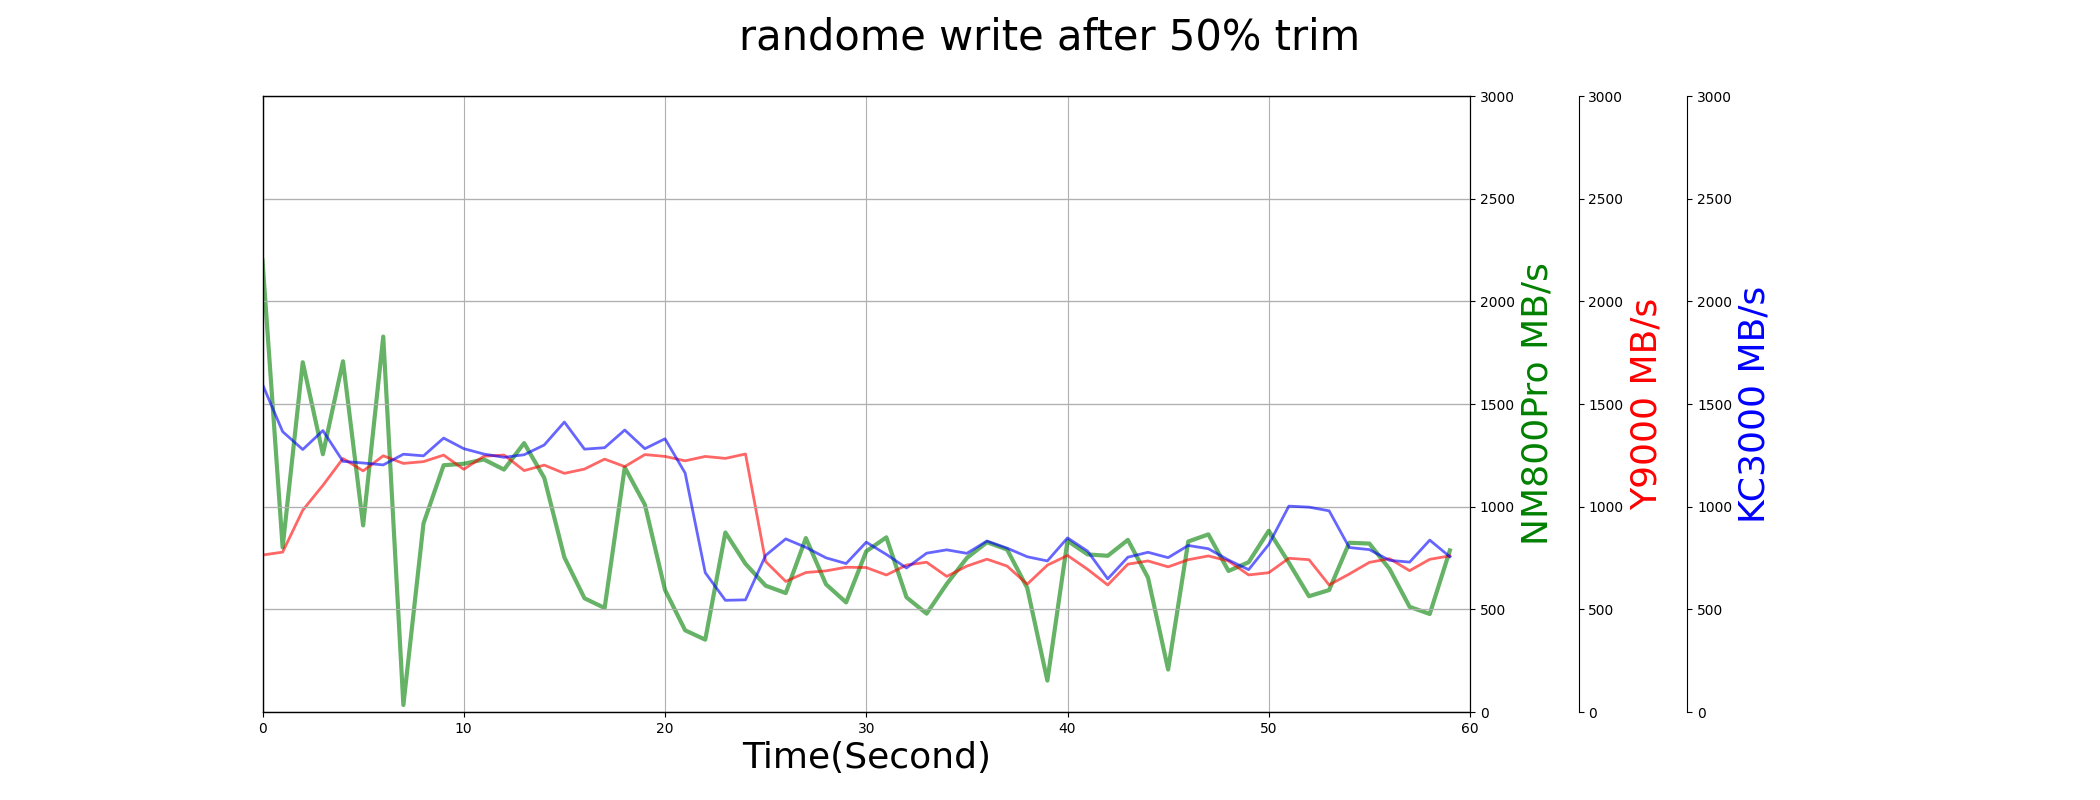
NM800Pro’s average random write IOPS is not bad. But, its IOPS is not stable.
Trim
Except for read and write, Trim is also a common command in nowadays’ OS. We test its performance by trim half LBA space.
| IOPS (K) | Max Latency (ms) | Average Latency (ms) | performance before trim (MB/s) | performance after trim (MB/s) | |
|---|---|---|---|---|---|
| NM800Pro | 17.442 | 274.478 | 0.892 | 1958.989 | 3476.630 |
| Y9000 | 1.703 | 1036.134 | 9.382 | 1674.617 | 3431.828 |
| KC3000 | 1.985 | 142.872 | 8.010 | 1694.944 | 3420.778 |
Its trim is super fast, though the max latency issue is still there.
Power
If we use SSD in laptop, the power consumption is also a key consideration. We list TMT1/2 setting below.
| TMT1 (℃) | TMT2 (℃) | |
|---|---|---|
| NM800Pro | 74 | 84 |
| Y9000 | 75 | 78 |
| KC3000 | 75 | 78 |
Low Power State
| PS4 measured power (mW) | PS4 exit duration (us) | PS3 measured power (mW) | PS3 exit duration (us) | |
|---|---|---|---|---|
| NM800Pro | 4.9 | 40635.9 | 67.5 | 1969.2 |
| Y9000 | 2.7 | 155604.6 | 45.2 | 155162.6 |
| KC3000 | 69.0 | 9727.1 | 85.7 | 9728.0 |
NM800Pro’s PS4 power consumption is less than 5mW, and it can exit from PS4 in 40ms. It is a good balance.
Active Power Consumption
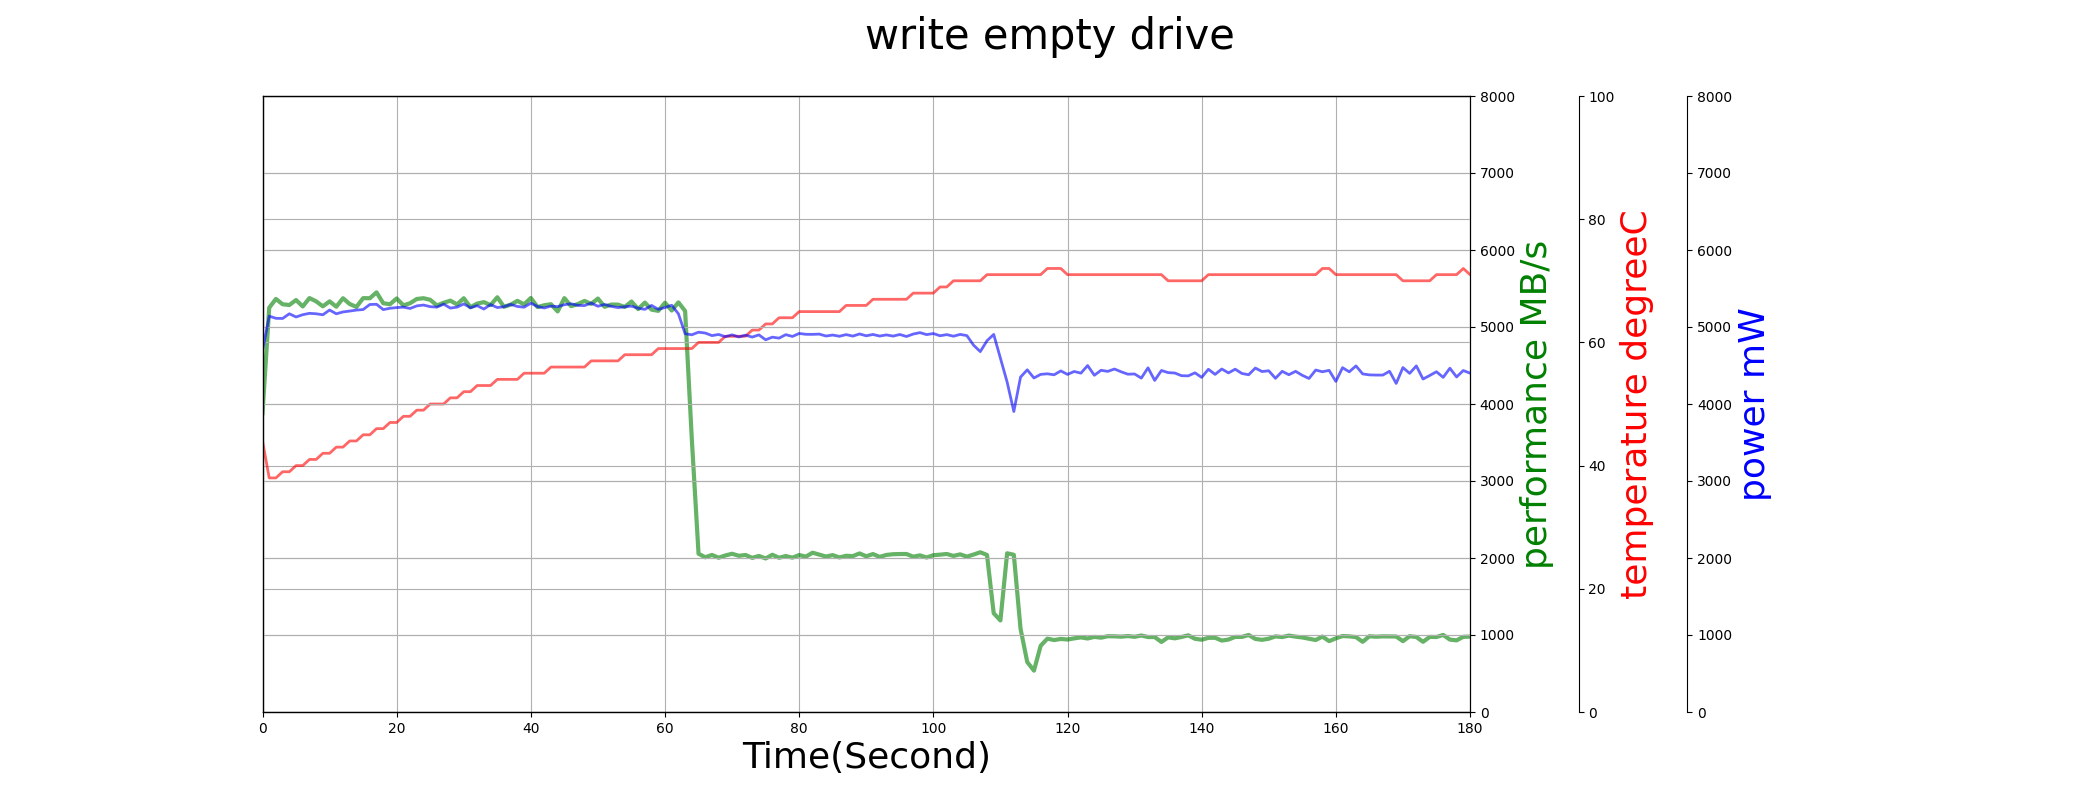
Its write performance is high and stable when the drive is empty (no GC operations). But when the drive is filled up, the write performance is not stable.
Reliability
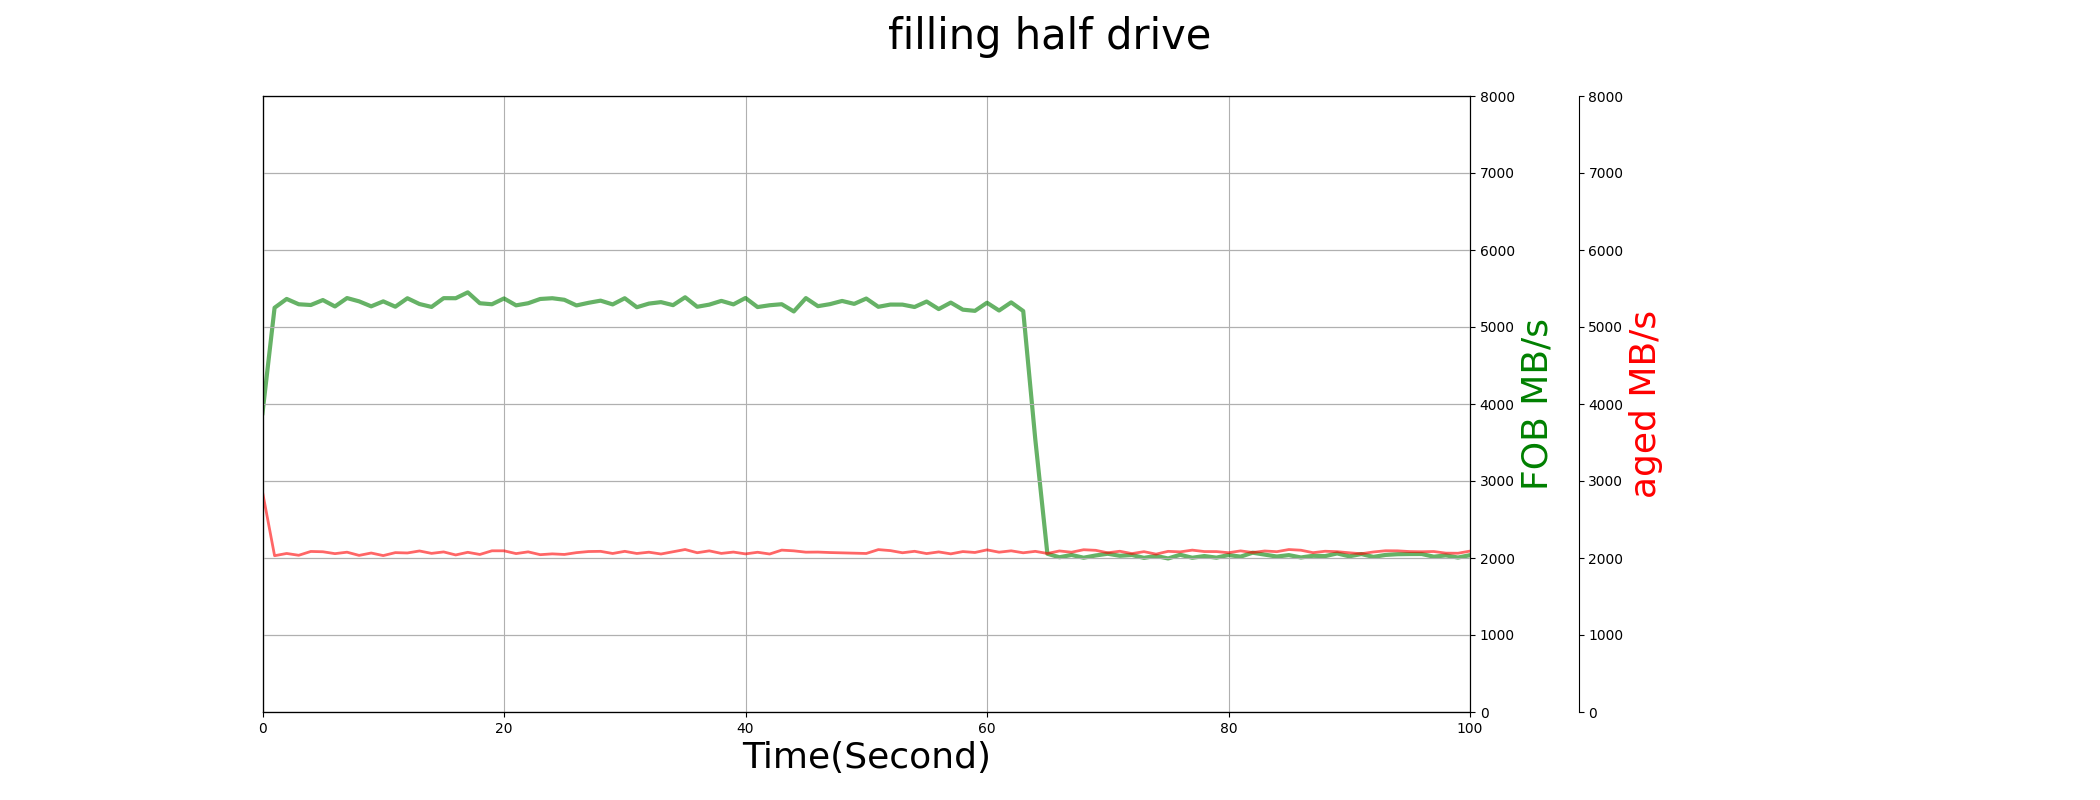
SLC cache retirement
NM800Pro use the whole capacity as SLC cache. When the drive is young and utilized space is low, it gives user the highest performance. But the SLC cache disappears on aged drive (after 1000 PE).
Data Retention
In our whole test process, we will write each DUT to its EOL (about 3000 P/E cycle for TLC SSD), then write the whole drive and keep them without power at the room temperature for 2 month. After that, we read the whole drive and verify its data integrity. Here is the test result.
| Data Units Written (1000LBA) | read speed 0 (MB/s) | read speed 2 (MB/s) | |
|---|---|---|---|
| NM800Pro | 3688131788 | 6329 | 1452 |
| Y9000 | 3788044394 | 3921 | 3333 |
| KC3000 | 3849016648 | 4880 | 1456 |
‘read speed 0’ is captured right after the data was written, and ‘read speed 0’ is captured 2-month later. SN850 was written by much more data intentionally. We check the result of ‘read speed 2’.
NM800Pro’s ‘read speed 2’ degrade a lot, but no UECC happen. It is quite common on big SLC cache drive.