Solidigm P41 Plus 1TB Test Report
| Model Name | Firmware Version | TMT1 (℃) | TMT2 (℃) | |
|---|---|---|---|---|
| P41Plus | SOLIDIGM SSDPFKNU010TZ | 002C | 73 | 76 |
1. Half Drive Fill
Test Procedure
- Format the DUT.
- Fill 50% of DUT’s capacity.
Expected Outcomes
- Monitor performance shifts from SLC to QLC.
- Maintain stable SLC write performance, aiming for the highest possible results.
- Maintain stable QLC write performance, aiming for the highest possible results.
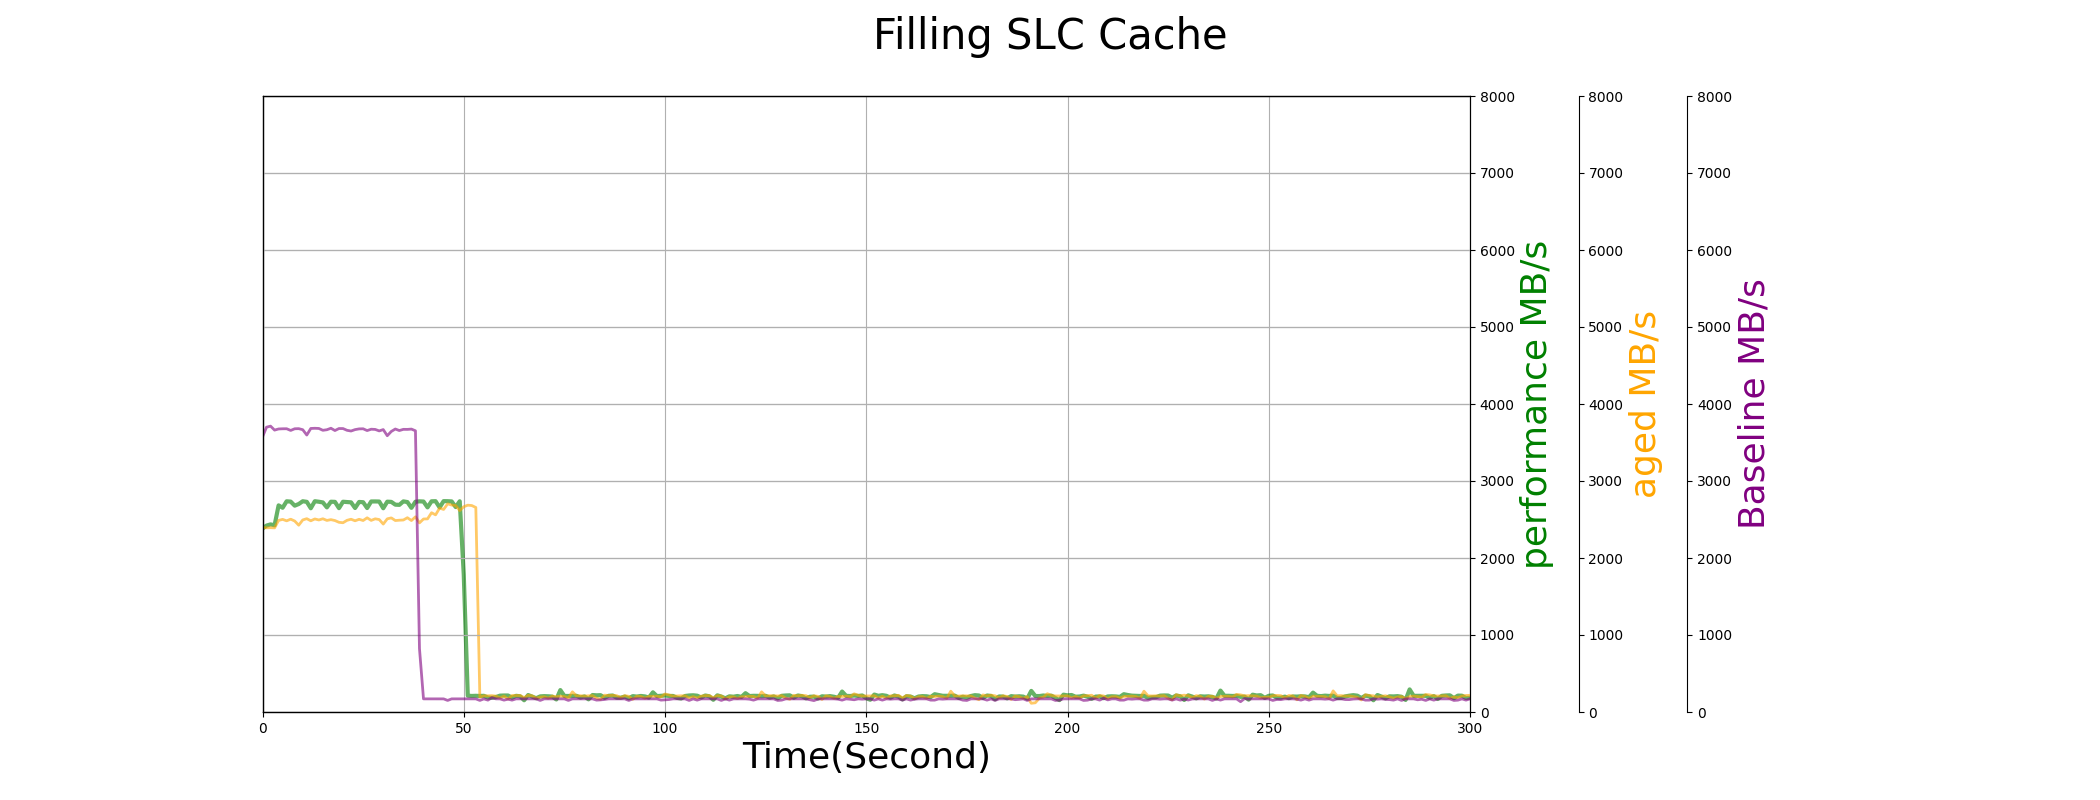
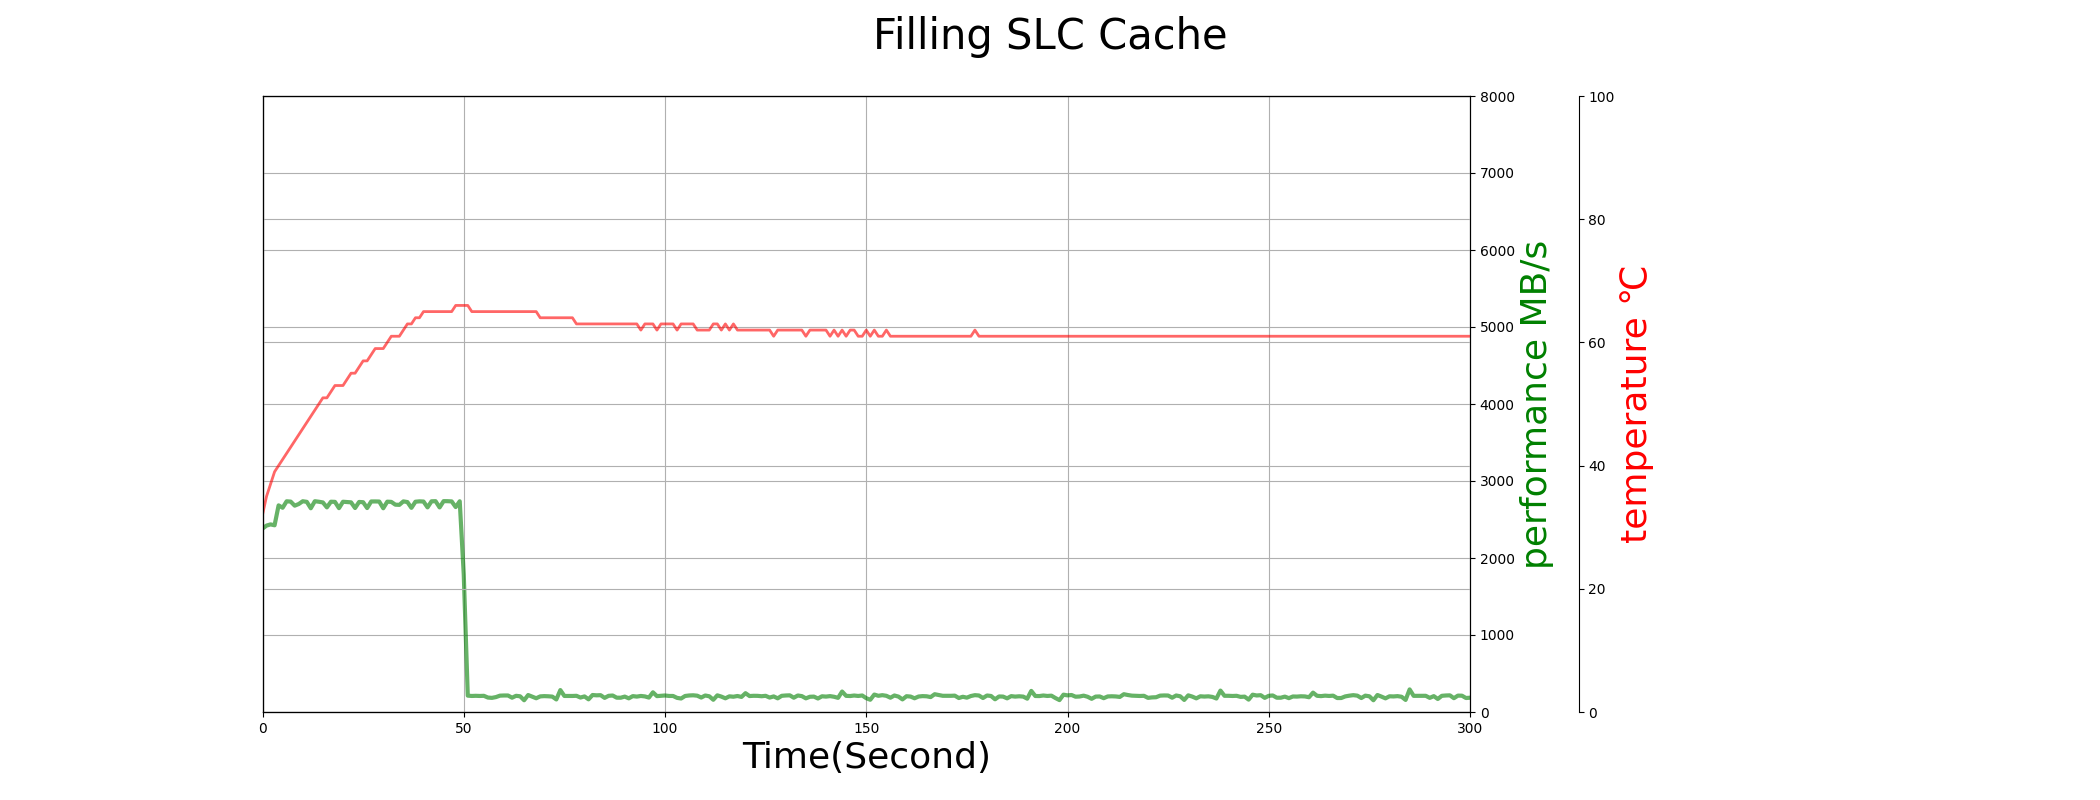
Results
Both fresh-out-of-box (FOB) and aged states of the Solidigm P41 Plus 1TB SSD maintain effective SLC caching, with good performance during the QLC phase. Temperature control is well-managed, with no instances of thermal throttling observed.
2. SLC Reclaim
Test Procedure
- Loop1: Idle for 1 minute, followed by sequential writing for 1 minute.
- Loop2: Idle for 2 minutes, followed by sequential writing for 1 minute.
- Loop3: Idle for 3 minutes, followed by sequential writing for 1 minute.
- Loop4: Idle for 4 minutes, followed by sequential writing for 1 minute.
Expectations
- Monitor and record the SLC write performance during each loop.
- Expect to see an extended SLC write stage in successive loops as the idle duration increases, indicating effective SLC reclaim.
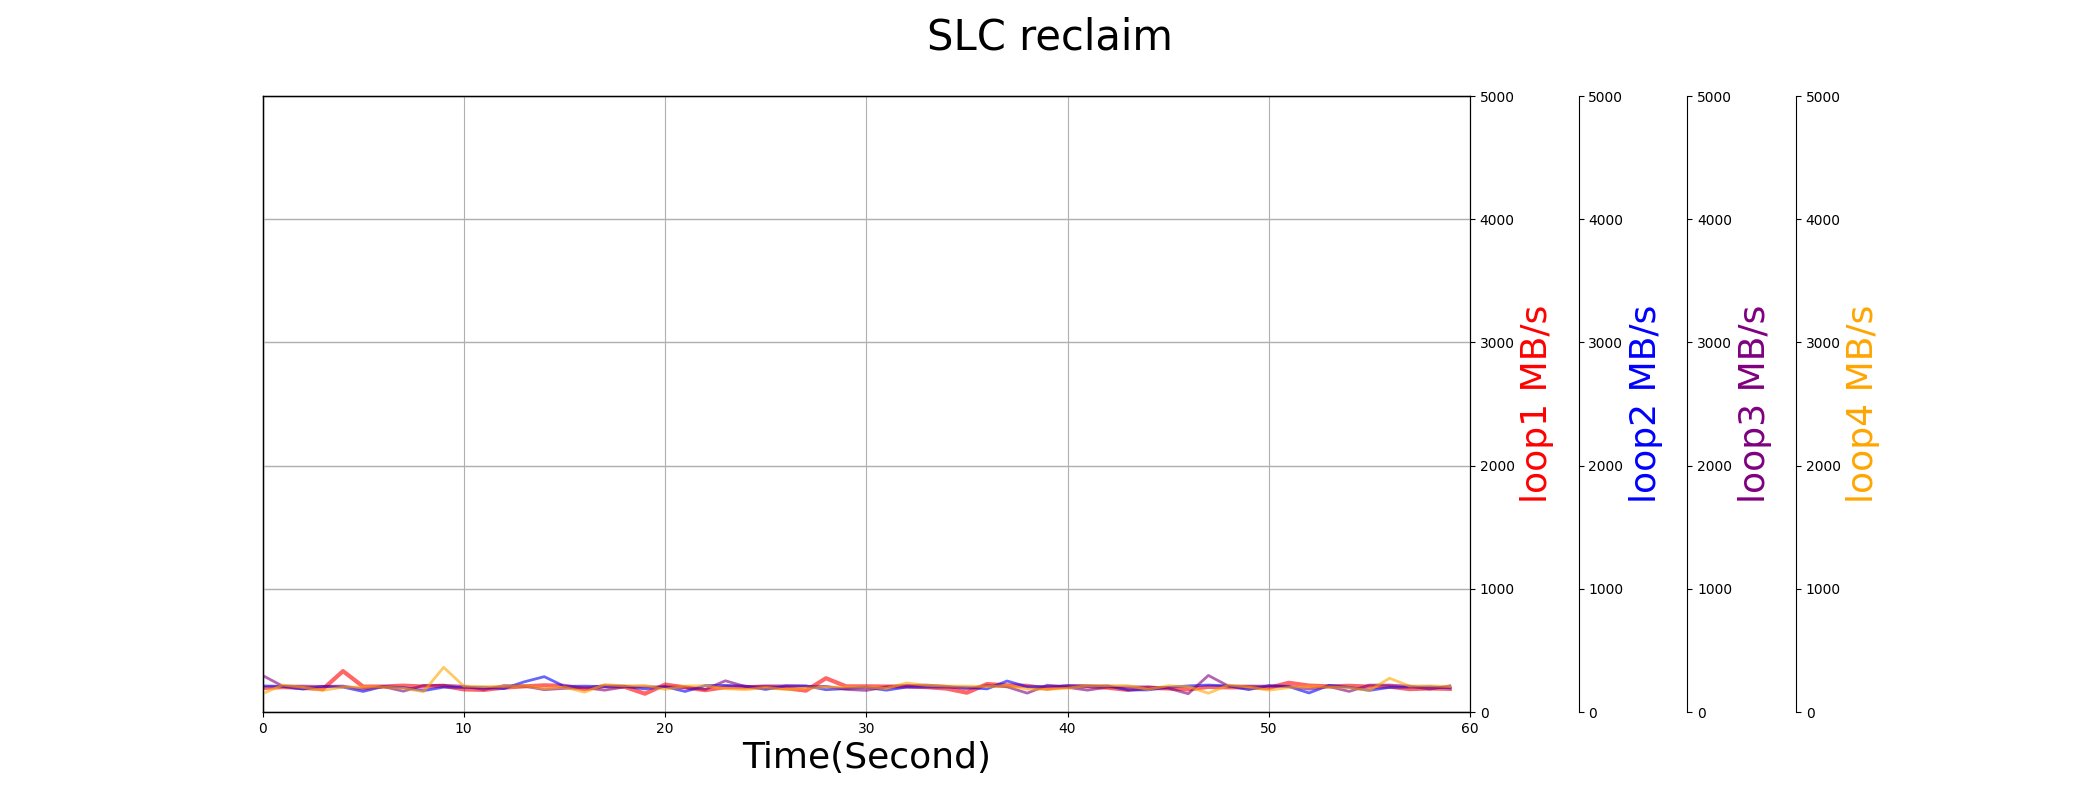
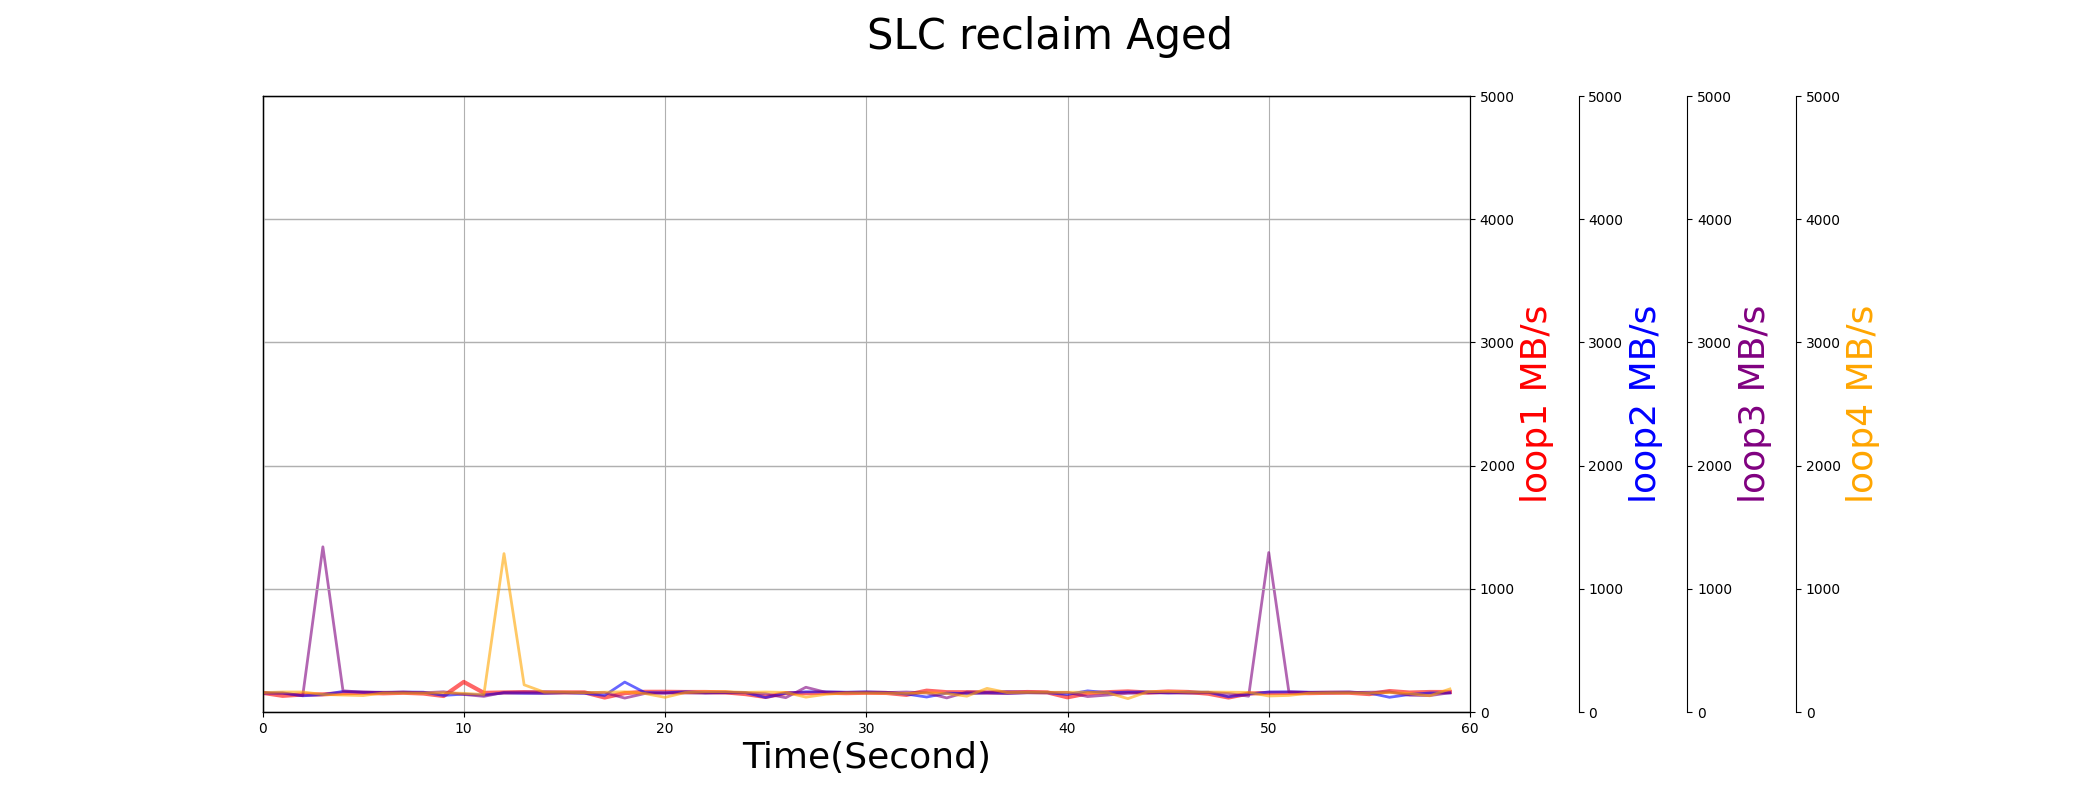
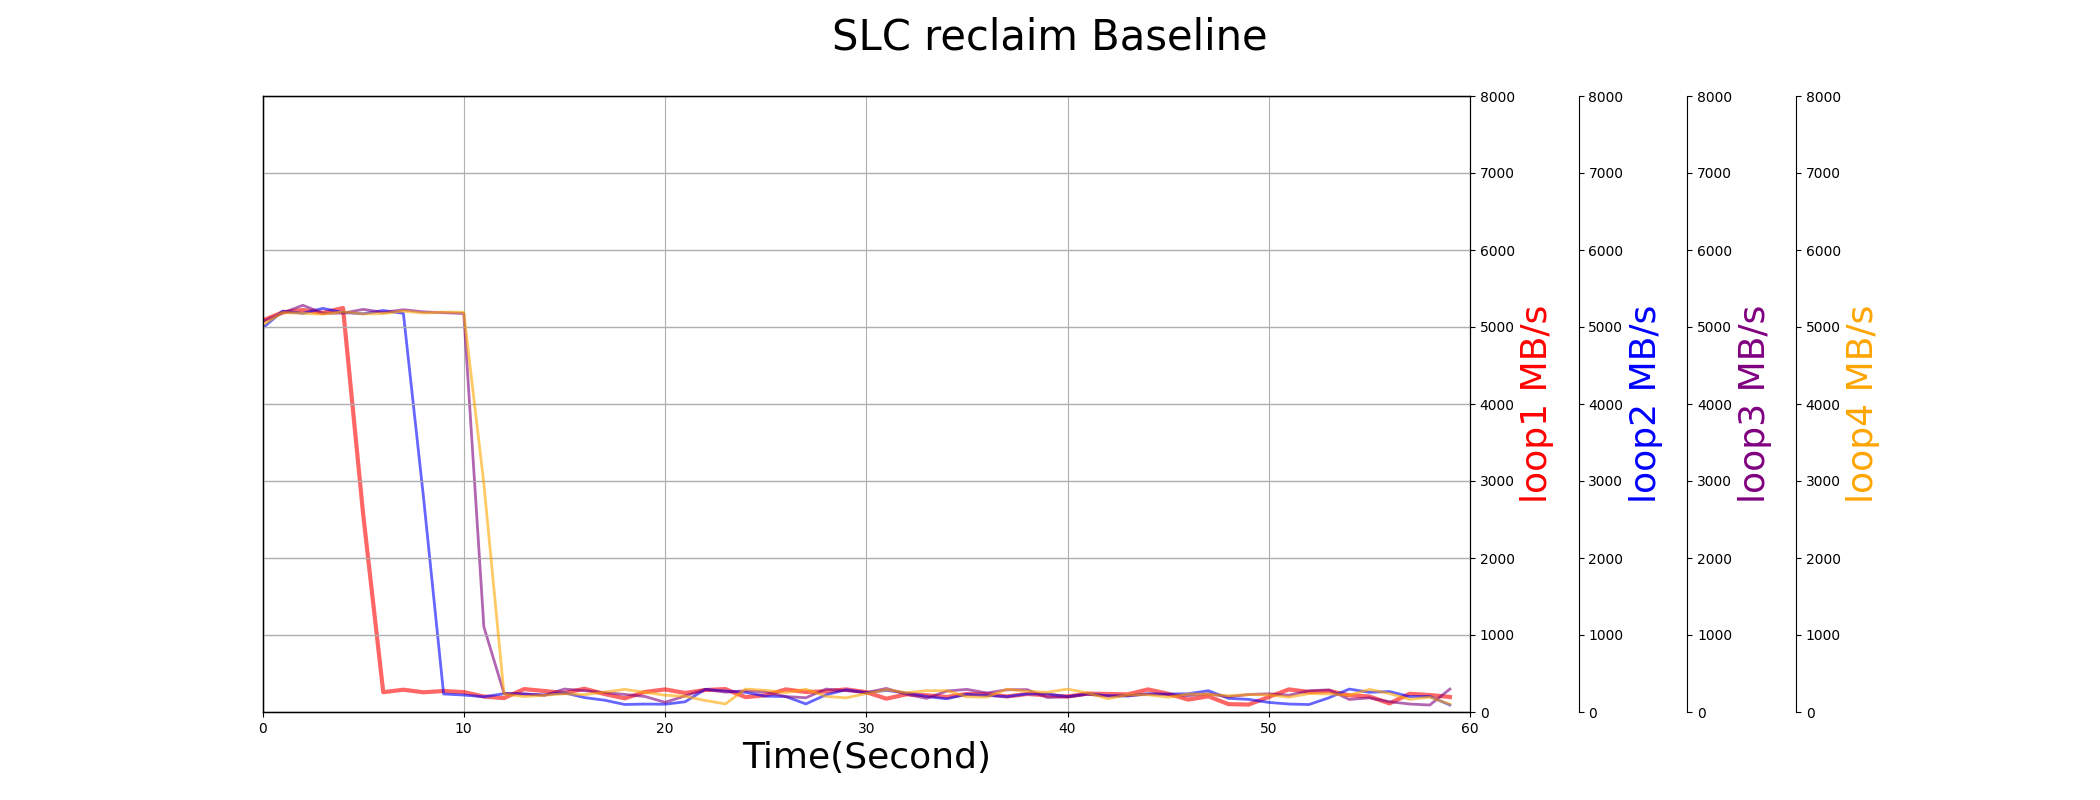
Results
After consuming half of the disk capacity, no release of SLC cache was observed in either FOB or aged states, even after up to four minutes of idle time. When much of the disk space is used, the unavailability of SLC cache leads to a significant decline in user experience.
3. Sequential Speed
Test Procedure
- Fill 10% of the drive’s capacity.
- Measure sequential read and write performance.
- Fill 50% of the drive’s capacity.
- Measure sequential read and write performance again.
Expectations
- The sequential read performance should remain consistent regardless of the capacity filled.
- Both read and write performance should not degrade due to aging.
| 10% fill read MB/s | 50% fill read MB/s | 10% fill write MB/s | 50% fill write MB/s | |
|---|---|---|---|---|
| P41Plus | 3676.733 | 2552.538 | 1862.463 | 218.954 |
| Aged | 3392.095 | 2571.565 | 288.481 | 205.067 |
| Baseline | 5227.481 | 4718.039 | 3852.158 | 425.910 |
Results
Read performance remains satisfactory. However, due to the frequent unavailability of SLC cache, the write performance is significantly impaired.
4. Random IOPS
Test Procedure
- Fill 10% of the drive’s capacity.
- Measure random read and write performance.
- Fill 50% of the drive’s capacity.
- Measure random read and write performance again.
Expectations
- The random read performance should remain consistent regardless of the capacity filled.
- Both random read and write performance should not degrade due to aging.
| 10% fill read K | 50% fill read K | 10% fill write K | 50% fill write K | |
|---|---|---|---|---|
| P41Plus | 30.113 | 15.999 | 9.081 | 7.272 |
| Aged | 25.615 | 16.937 | 6.472 | 7.278 |
| Baseline | 189.532 | 195.910 | 51.637 | 53.204 |
Results
Both random read and write performance are notably low.
5. QD1 Latency
Test Procedure
- Fill 10% of the drive’s capacity.
- Test random 512B QD1 read and write for 99.9% latency.
- Fill 50% of the drive’s capacity.
- Test random 512B QD1 read and write for 99.9% latency again.
Expectations
- The read latency should remain consistent, unaffected by the capacity filled.
- Both read and write latencies should not degrade due to aging.
| 10% fill read 99.9% latency ms | 50% fill read 99.9% latency ms | 10% fill write 99.9% latency ms | 50% fill write 99.9% latency ms | |
|---|---|---|---|---|
| P41Plus | 0.309 | 0.310 | 3.844 | 9.718 |
| Aged | 0.308 | 0.309 | 3.797 | 9.818 |
| Baseline | 0.173 | 0.171 | 1.759 | 1.824 |
Results
Latency control is generally effective, but write latency becomes extended after the drive is filled to 50%, primarily due to the absence of SLC cache.
6. Low Loading Latency
Test Procedure
- Set the IOPS to 10 and measure the 99.9% latency for reads.
- Set the IOPS to 100 and measure the 99.9% latency for reads.
- Conduct a read/write mix with 90% reads at a fixed 1000 IOPS and measure the 99.9% latency.
- Conduct a read/write mix with 50% reads and measure the 99.9% latency.
- Replay the JEDEC client workload and record the replay duration time.
Expectations
- The lower the latency, the better.
- Latencies exceeding 300ms are considered detrimental to user experience.
| 10 IOPS 99.9% read Latency (ms) | 100 IOPS 99.9% read Latency (ms) | mix IO 99.9% Latency (ms) | 90% mix 99.9% Latency (ms) | JEDEC workload replay (s) | |
|---|---|---|---|---|---|
| P41Plus | 24.459 | 1.989 | 118.427 | 423.263 | 4220.900 |
| Aged | 3.824 | 12.899 | 125.784 | 420.296 | 3073.463 |
| Baseline | 4.062 | 0.191 | 154.823 | 13.235 | 2651.787 |
Results
Mixed read and write operations exhibit latencies exceeding 300ms. However, the JEDEC workload replay times are acceptable, making the drive suitable for general office applications.
7. Low Power State
Test Procedure
- Format the Device Under Test (DUT).
- Transition the DUT to Power State 4 (PS4) using the
setfeaturescommand. - Measure power consumption in PS4.
- Send IO commands to transition out of PS4.
- Measure the latency to exit from PS4.
- At a fixed 10 IOPS, measure the power consumption under an idle/active mixed workload.
Expectation
- Lower power consumption is preferable.
| idle power mW | PS4 exit Latency (us) | 10 IOPS power (mW) | |
|---|---|---|---|
| P41Plus | 3.3 | 23764.3 | 1206.825 |
| Aged | 31.1 | 10015.2 | 389.452 |
| Baseline | 2.5 | 25070.8 | 250.728 |
Results
The power consumption while idle was commendably low. However, during low-loading workloads that mixed idle and active states, the power consumption was notably higher.
8. Trim Efficiency
Test Procedure
- Format the DUT and fill it to 90% capacity.
- Measure sequential write performance.
- Trim the first 50% of the DUT’s capacity.
- Measure the average latency of the executed trim commands.
- Measure sequential write performance again after the trim.
Expectation
- The latency for trim operations should be as short as possible.
- Sequential write performance should improve following the trim operation.
- Aging should impact the efficiency of trim performance.
| Average Latency (ms) | performance before trim (MB/s) | performance after trim (MB/s) | |
|---|---|---|---|
| P41Plus | 34.166 | 196.462 | 2245.729 |
| Aged | 33.349 | 269.041 | 2252.922 |
| Baseline | 3.839 | 695.887 | 2393.860 |
Results
Although the latency for trim operations is relatively long, it effectively restores performance significantly.
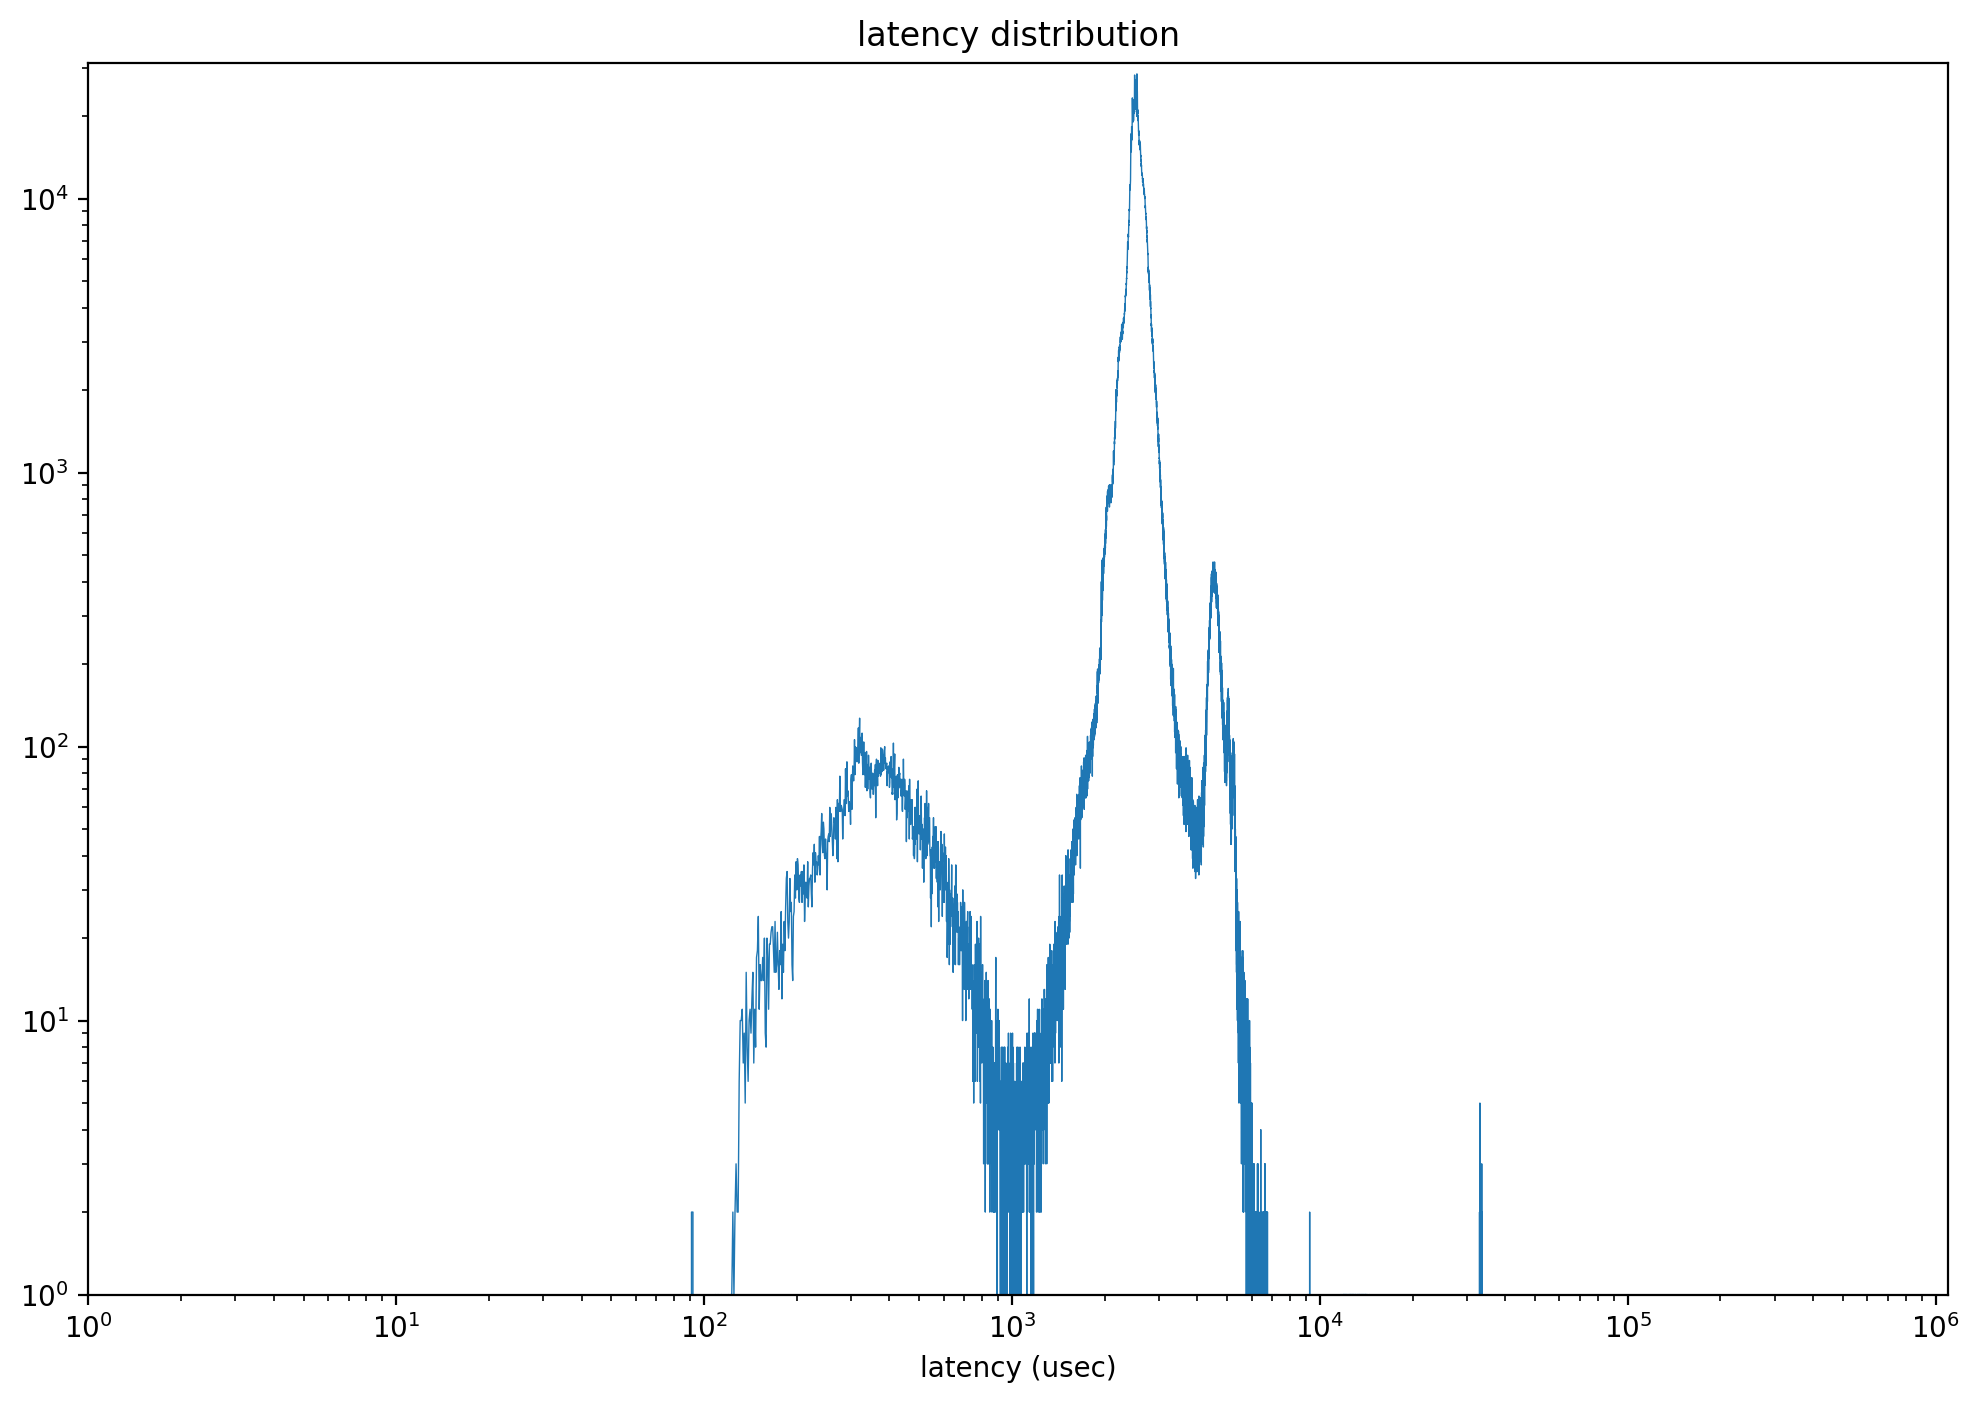
9. Data Retention
Test Procedure
- Fill the entire drive 300 times and age it to its End of Life (EOL).
- Format the DUT.
- Fill the entire drive again.
- Power off the device.
- Store the DUT at room temperature for two months.
- Power on the DUT.
- Read the entire drive and measure the distribution of read latencies.
Expectation
- The final read operation should complete successfully and quickly.
- There should be no read latencies longer than 100ms.
| distribution month 0 | distribution month 2 | |
|---|---|---|
| DUT | 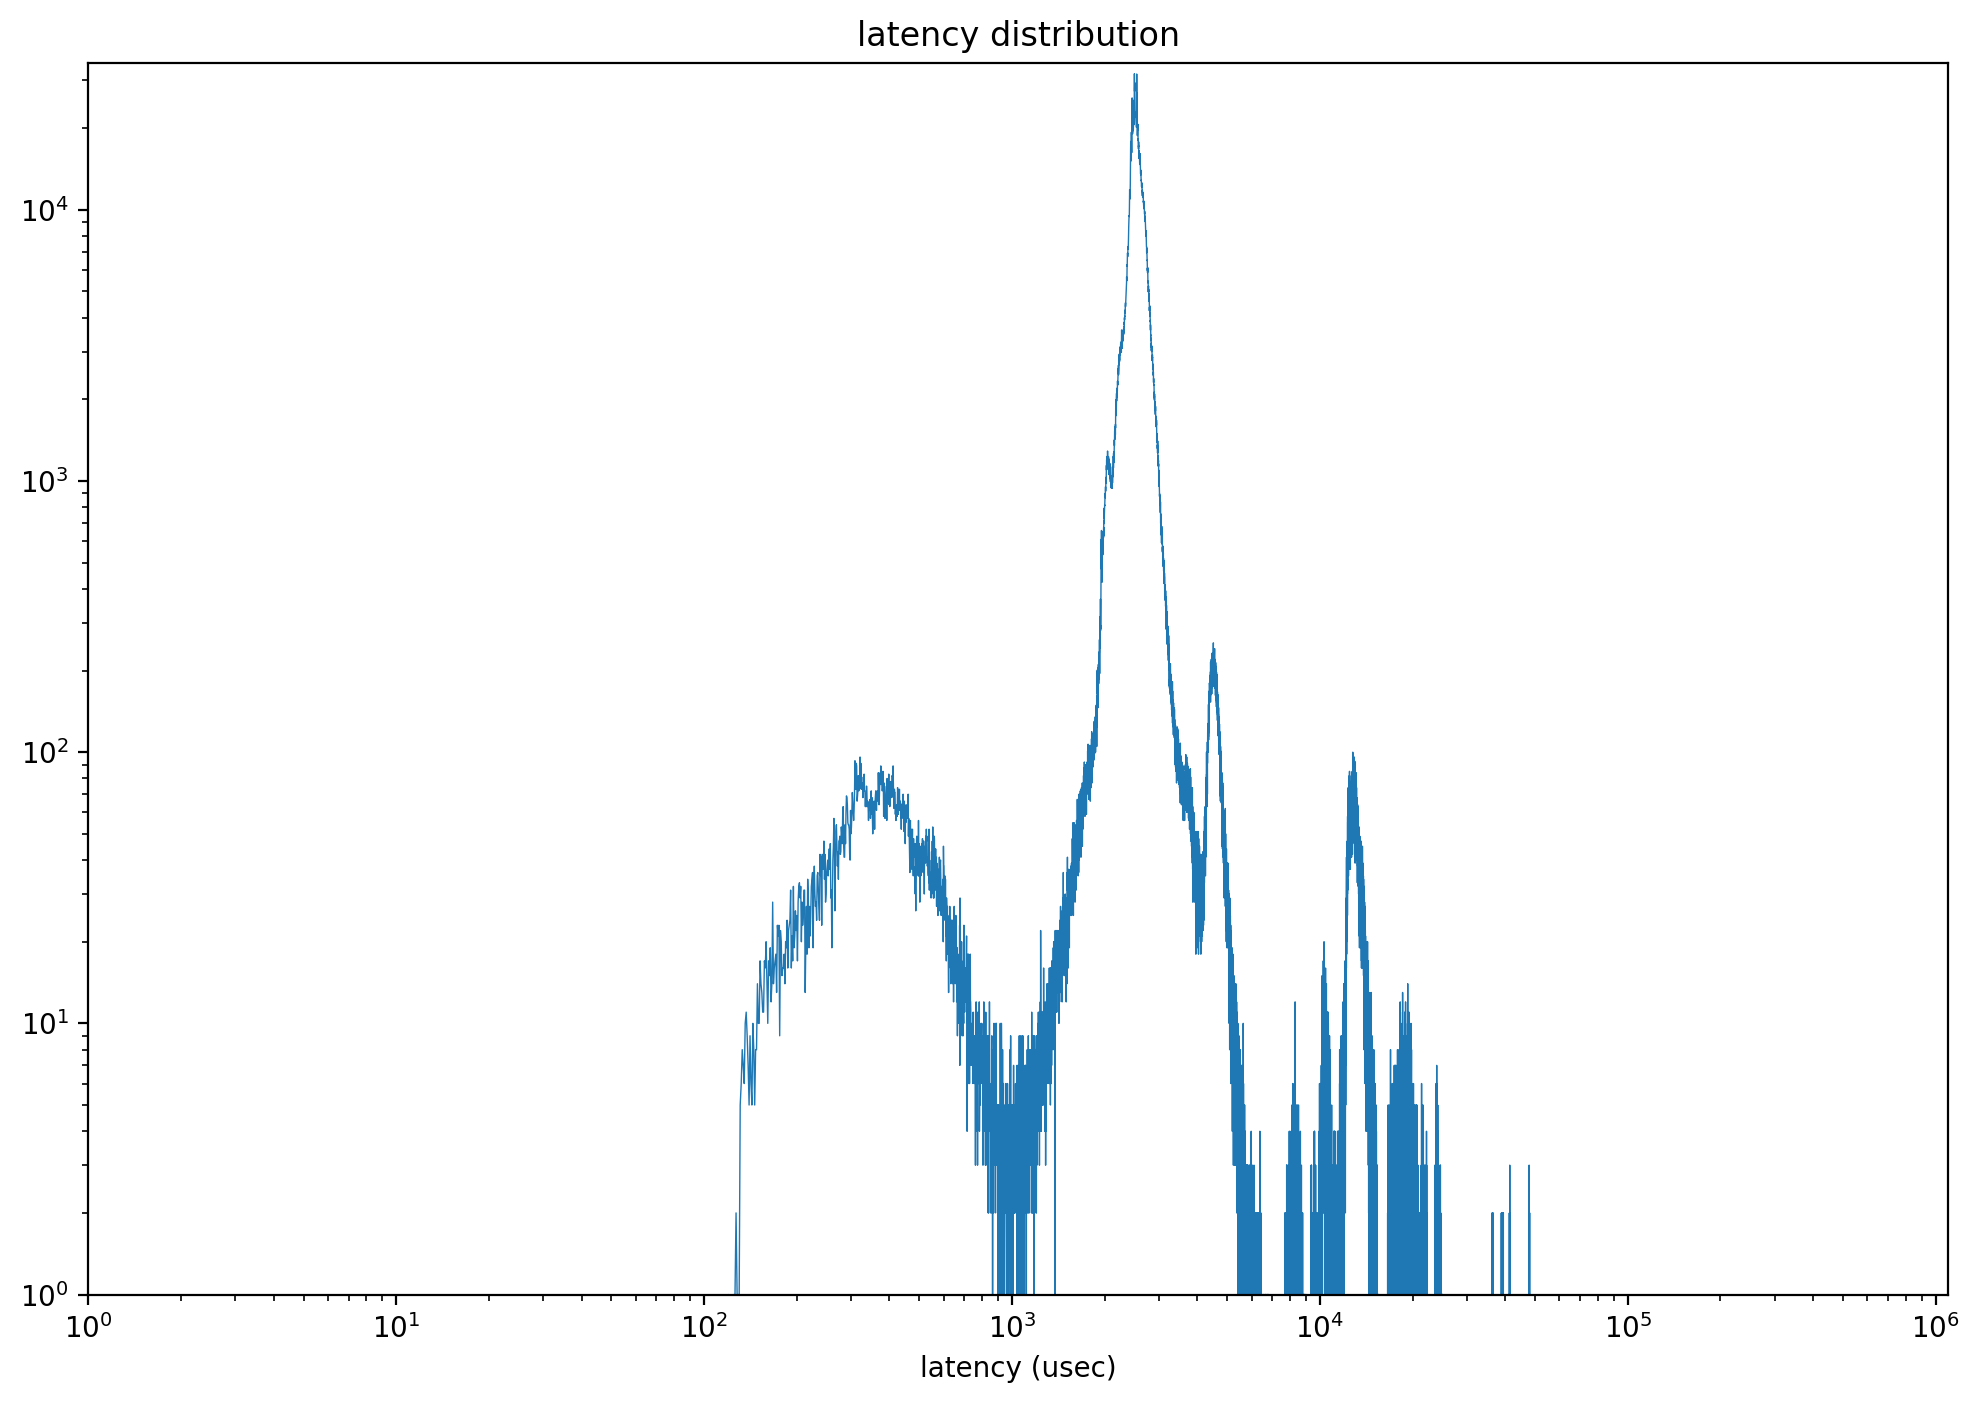 |
 |
| Baseline | 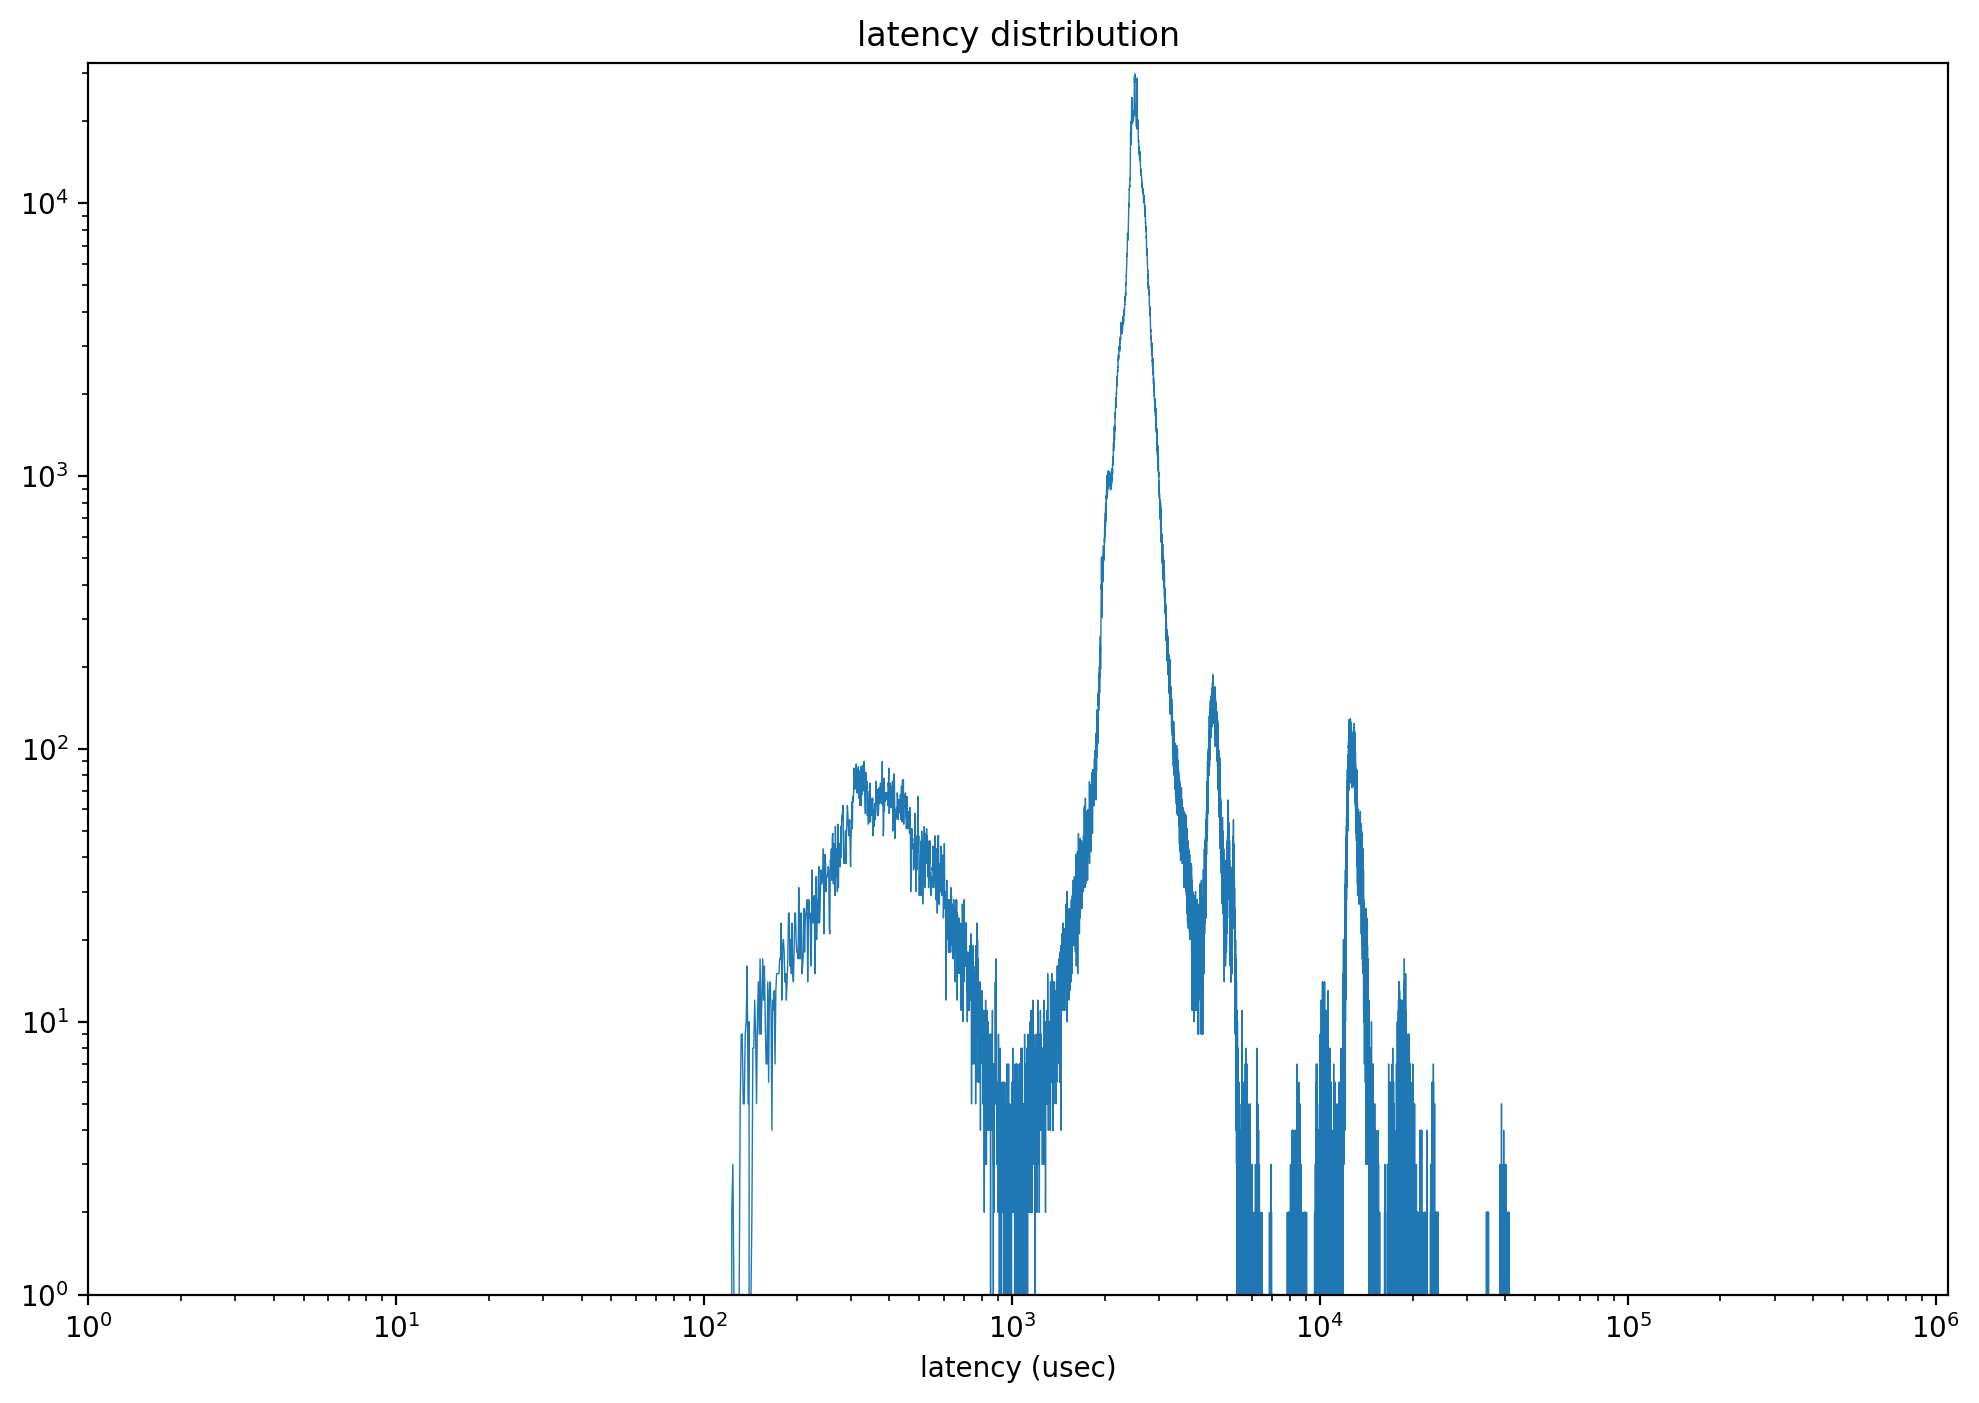 |
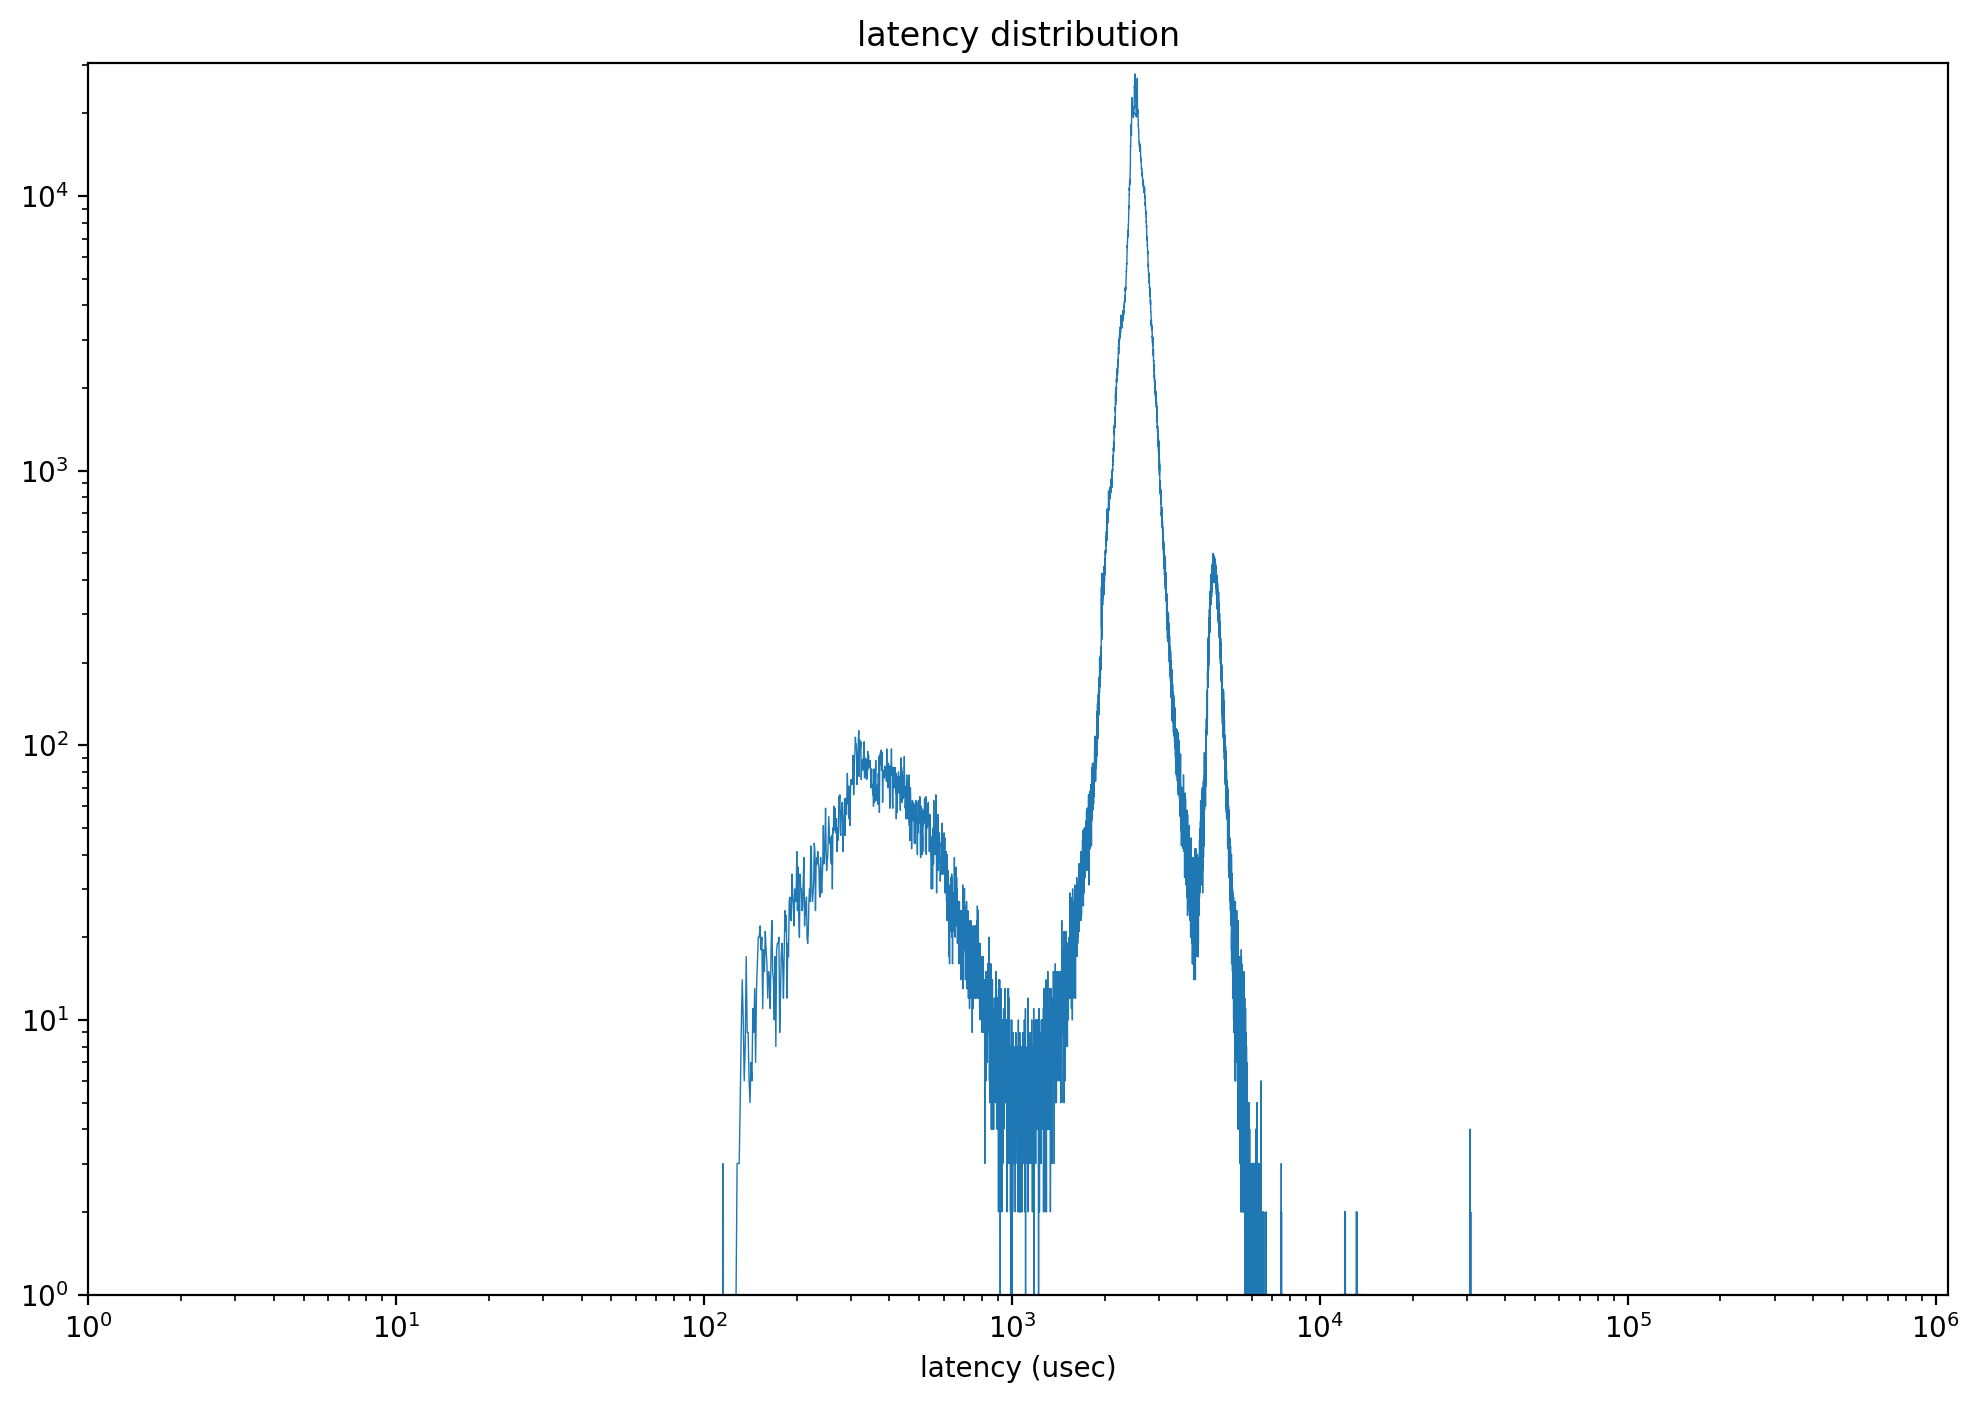 |
Results
The data retention performance is excellent, with the distribution of read latency showing no significant change after two months of power-off. Furthermore, reads with latencies greater than 10ms have notably decreased.
10. Other Tests
The following table summarizes the results of various additional tests conducted to assess different aspects of the Device Under Test (DUT). These tests evaluate the DUT’s conformance to standards, resilience to power on sequences, signal integrity (saw diagram), wear leveling efficiency, IO stress handling, and performance after aging.
| Item | Result |
|---|---|
| Conformance | PASS |
| Power On | PASS |
| Saw Diagram | PASS |
| Wear Leveling | PASS |
| IO Stress | PASS |
| Aging | PASS |
11. Summary
The Solidigm P41 Plus 1TB SSD demonstrates a well-rounded performance profile, though it encounters specific challenges:
- Read and Write Performance: The SSD provides robust read capabilities, yet struggles with write performance when more than half of the disk capacity is utilized, largely due to limited SLC cache availability.
- Latency Management: While the SSD generally manages latency well, there are notable increases in write latency beyond 50% capacity utilization. Mixed read/write activities can occasionally produce latencies over 300ms, though these do not typically impact routine office work.
- Trim Effectiveness: Trim operations, despite their prolonged latencies, significantly bolster performance, enabling the SSD to effectively recuperate from performance declines.
- Data Retention Strengths: The SSD stands out in data retention, consistently maintaining low read latencies even after extended downtimes, with an observed decrease in instances of higher latencies.