WD SN850 1T
Basic Information
In this report, we compare mainstream SSDs from NAND makers: WD SN850, Samsung 980Pro, Micron/Crucial P5Plus.
| Model Name | Firmware Version | |
|---|---|---|
| SN850 | WDS100T1X0E-00AFY0 | 614900WD |
| 980Pro | Samsung SSD 980 PRO 1TB | 5B2QGXA7 |
| P5Plus | CT1000P5PSSD8 | P7CR403 |
Latency
We still check their IO latency first.
Max Write Latency
| 10 IOPS (ms) | 4K 1QD (ms) | 512B 1QD 10p filled (ms) | 512B 1QD 50% filled (ms) | 4K mix RW 90% filled (ms) | |
|---|---|---|---|---|---|
| SN850 | 0.287 | 5.812 | 6.555 | 6.118 | 166.909 |
| 980Pro | 8.616 | 8.461 | 8.462 | 14.148 | 42.767 |
| P5Plus | 2.273 | 6.604 | 7.559 | 7.914 | 10.797 |
The latency is well controlled in light workload.
Speed
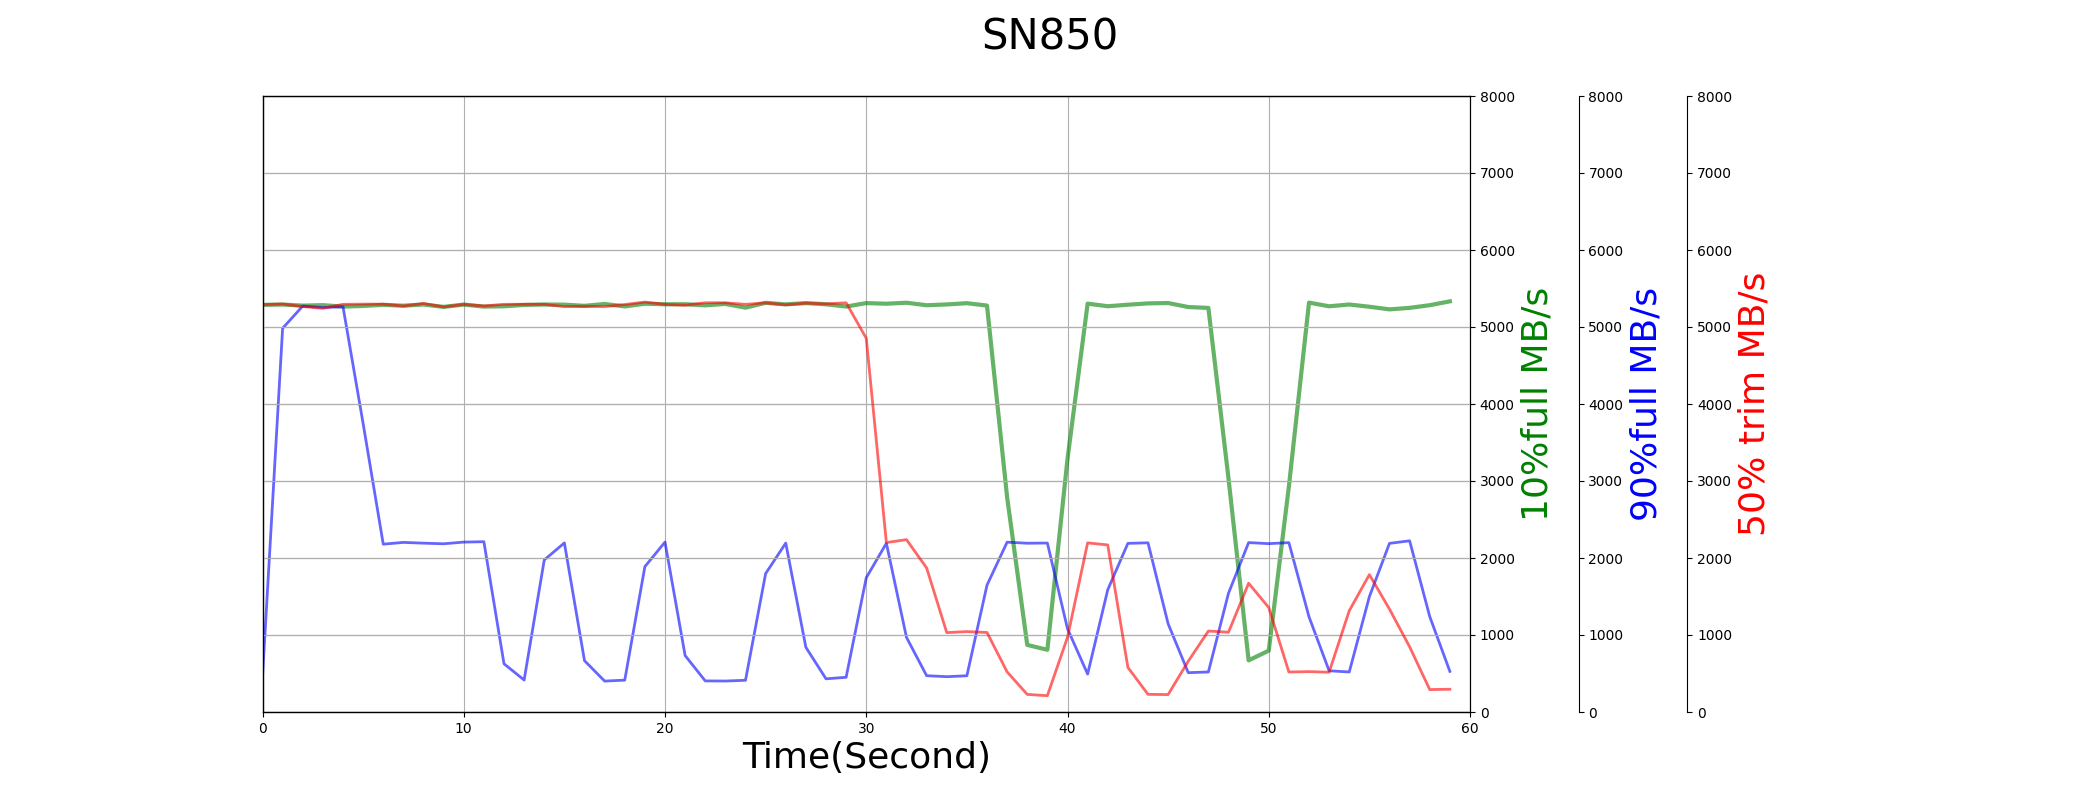
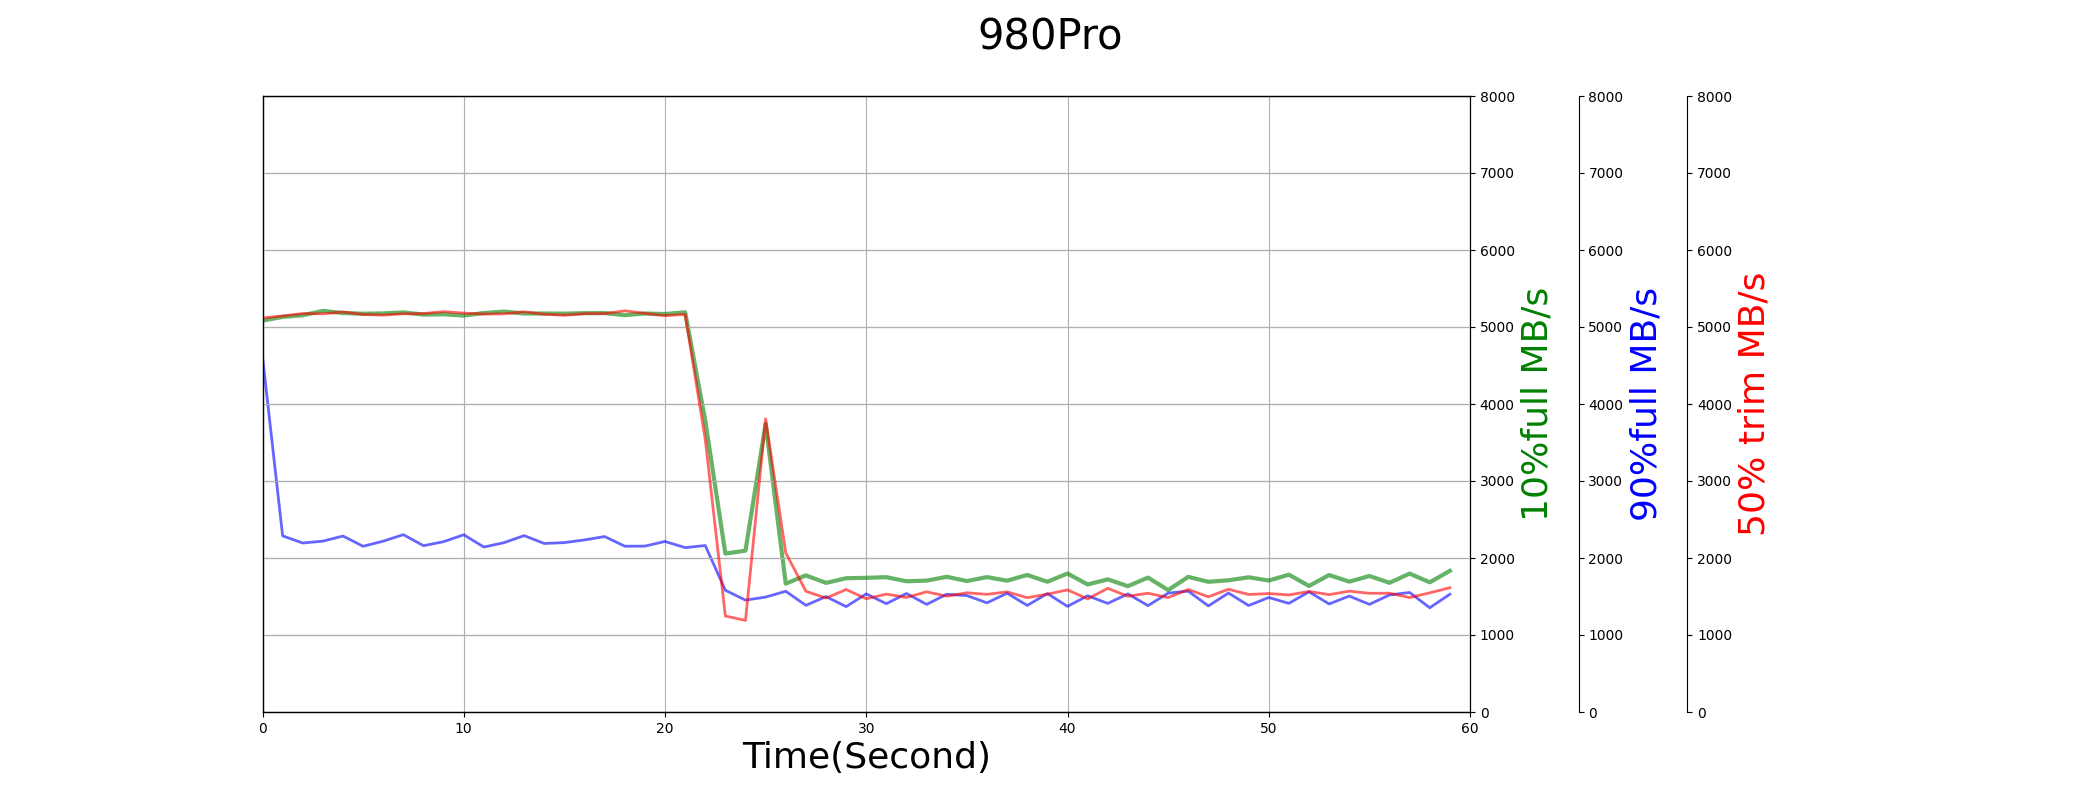
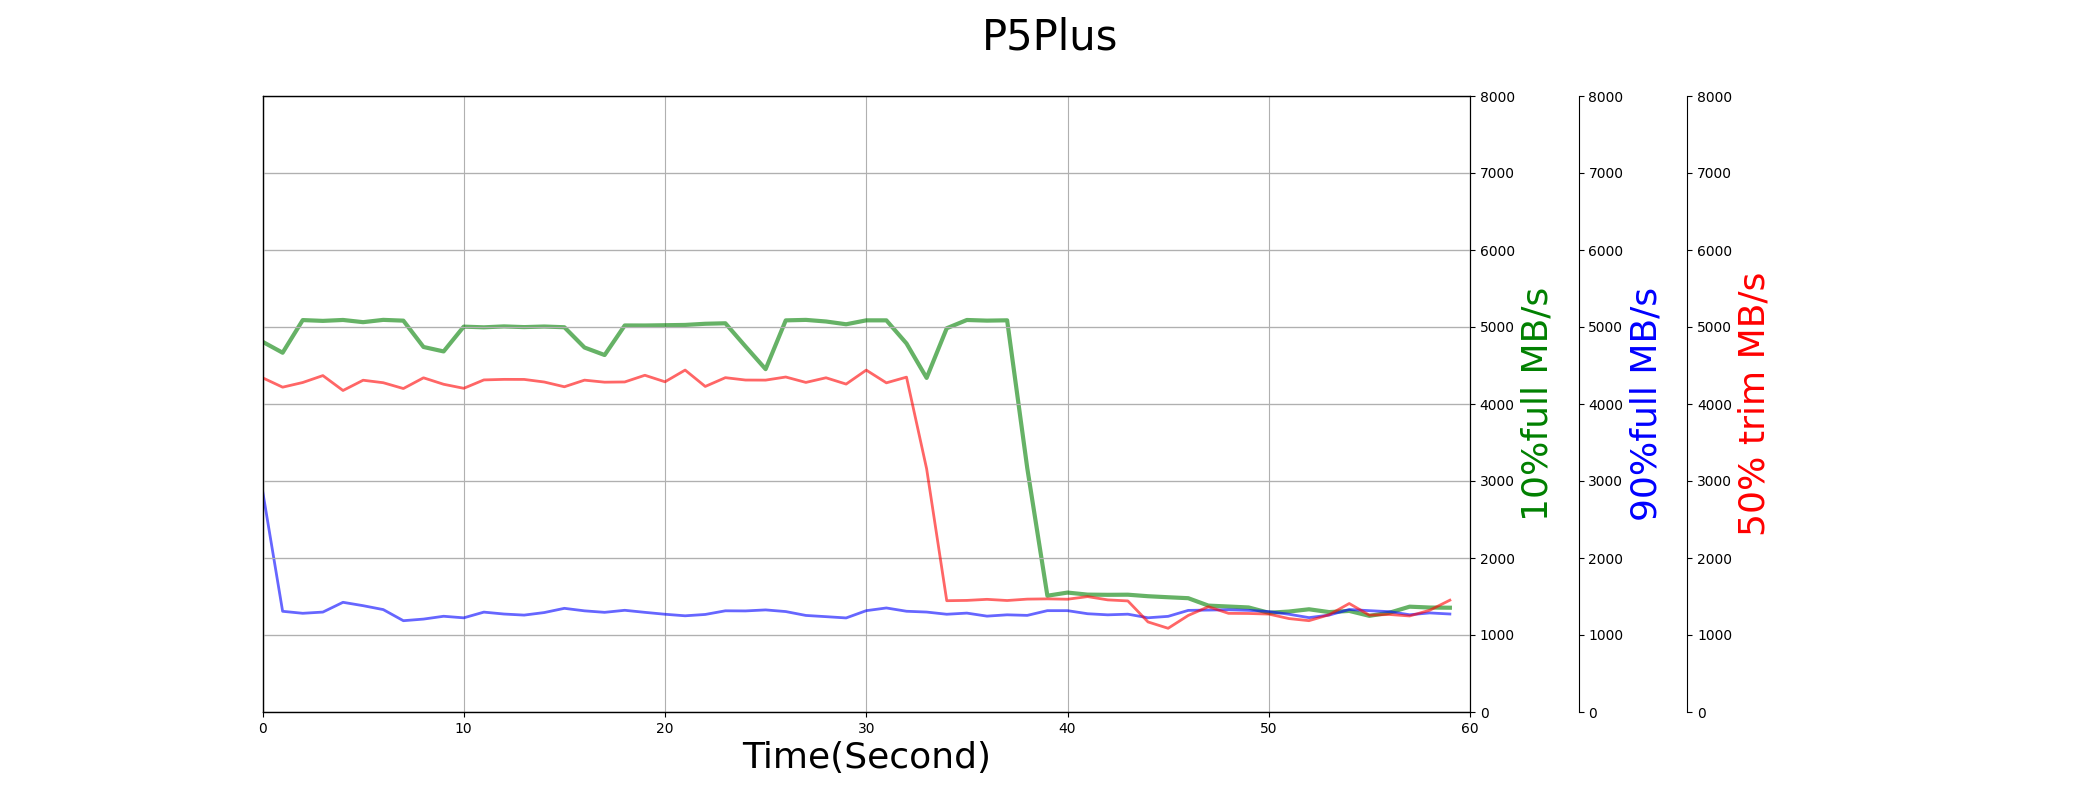
Sequential Write
| 10% filled (MB/s) | 90% filled (MB/s) | 50% trimmed (MB/s) | |
|---|---|---|---|
| SN850 | 4833.883 | 1649.519 | 3225.354 |
| 980Pro | 3065.800 | 1796.586 | 2938.130 |
| P5Plus | 3675.305 | 1313.732 | 2999.762 |
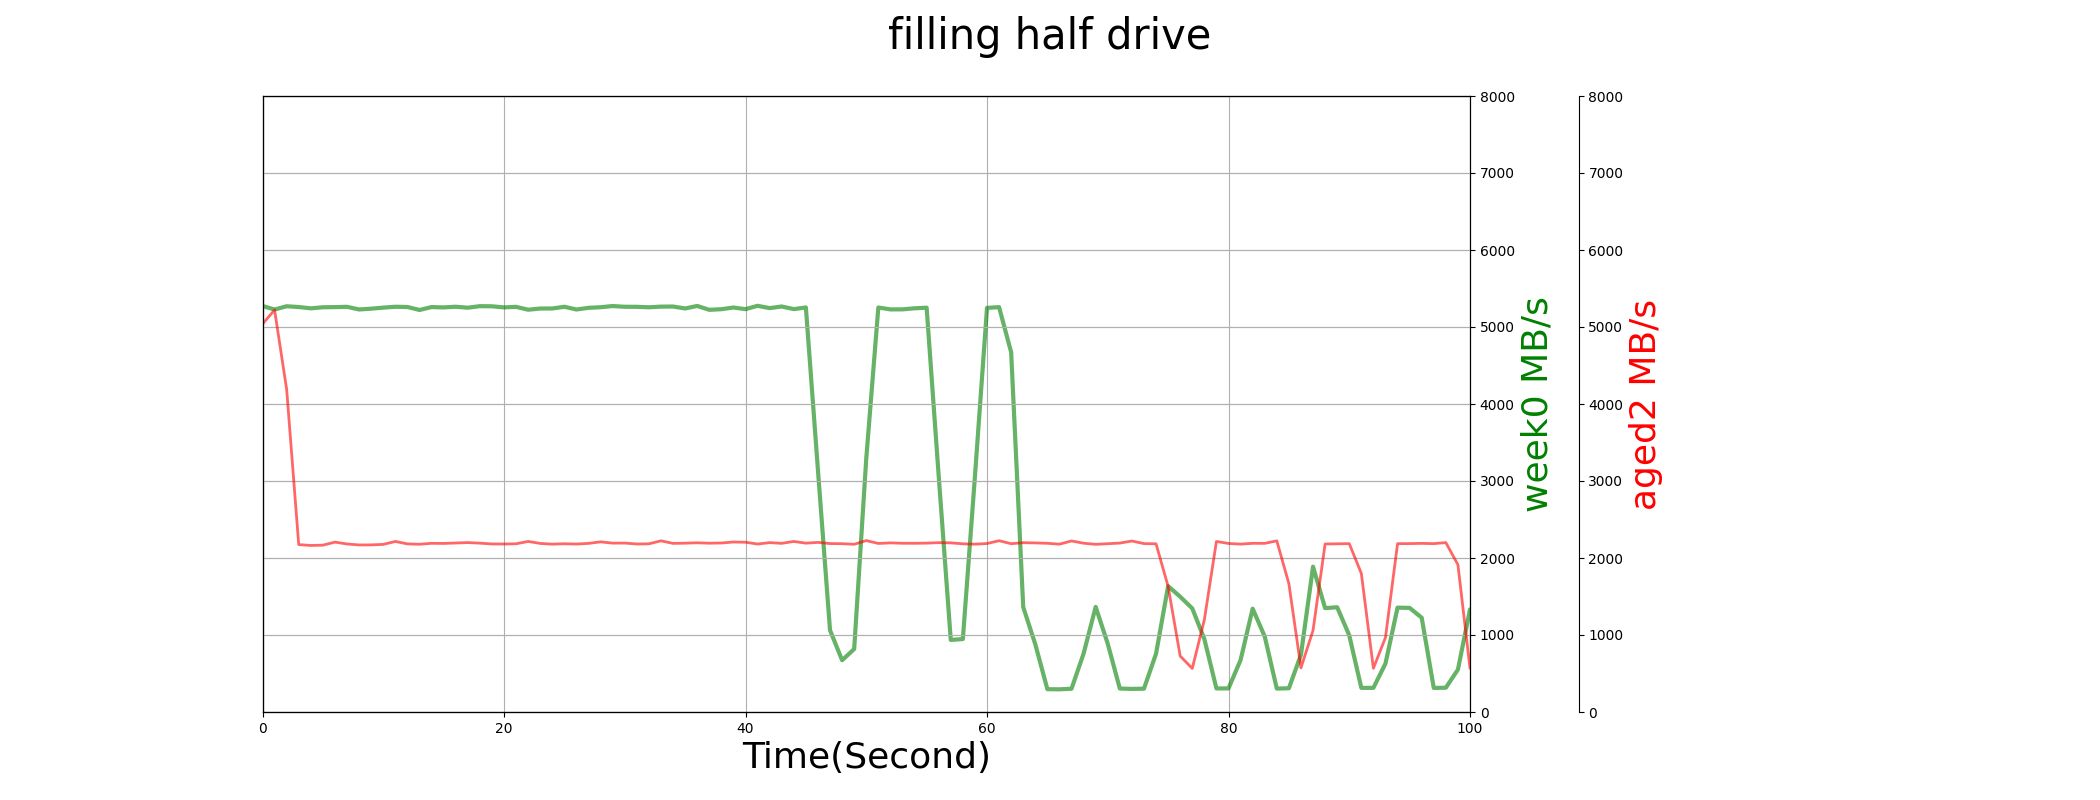
All drives have good and similar sequential write performance. The performance all degrade when drives are full filled, and recover after trim operations.
But from diagrams below, we can find the performance of SN850 is not stable.
Random Write
| 10% filled (K IOPS) | 90% filled (K IOPS) | 50% trimmed (K IOPS) | |
|---|---|---|---|
| SN850 | 280.283 | 158.988 | 279.883 |
| 980Pro | 386.622 | 544.405 | 506.412 |
| P5Plus | 558.473 | 258.988 | 356.303 |
SN850 randome write performance is not as good as other 2 drives, especially when the drive is fully filled.
Trim
Except for read and write, Trim is also a common command in nowadays’ OS. We test its performance by trim half LBA space. SN850 has the best trim performance. All 3 drives can benifit performance from Trim commands.
| IOPS (K) | Max Latency (ms) | Average Latency (ms) | performance before trim (MB/s) | performance after trim (MB/s) | |
|---|---|---|---|---|---|
| SN850 | 4.184 | 13.649 | 3.804 | 2029.665 | 3225.354 |
| 980Pro | 1.676 | 58.529 | 9.535 | 2172.154 | 2938.130 |
| P5Plus | 2.592 | 44.545 | 6.103 | 1566.011 | 2999.762 |
Power
If we use SSD in laptop, the power consumption is also a key consideration. We list TMT1/2 setting below.
| TMT1 (℃) | TMT2 (℃) | |
|---|---|---|
| SN850 | 80 | 82 |
| 980Pro | 81 | 82 |
| P5Plus | 76 | 79 |
Low Power State
| PS4 measured power (mW) | PS4 exit duration (us) | PS3 measured power (mW) | PS3 exit duration (us) | |
|---|---|---|---|---|
| SN850 | 1333.3 | 164.7 | 1332.1 | 164.1 |
| 980Pro | 2043.0 | 408.1 | 2044.1 | 417.2 |
| P5Plus | 60.8 | 25701.3 | 57.0 | 13695.6 |
SN850 cannot enter PS3 and PS4 low power mode in our test. The low power data is collected after Format operation and keep idle for 2 minutes. Suppose, there should be no background jos in this condition.
Active Power Consumption
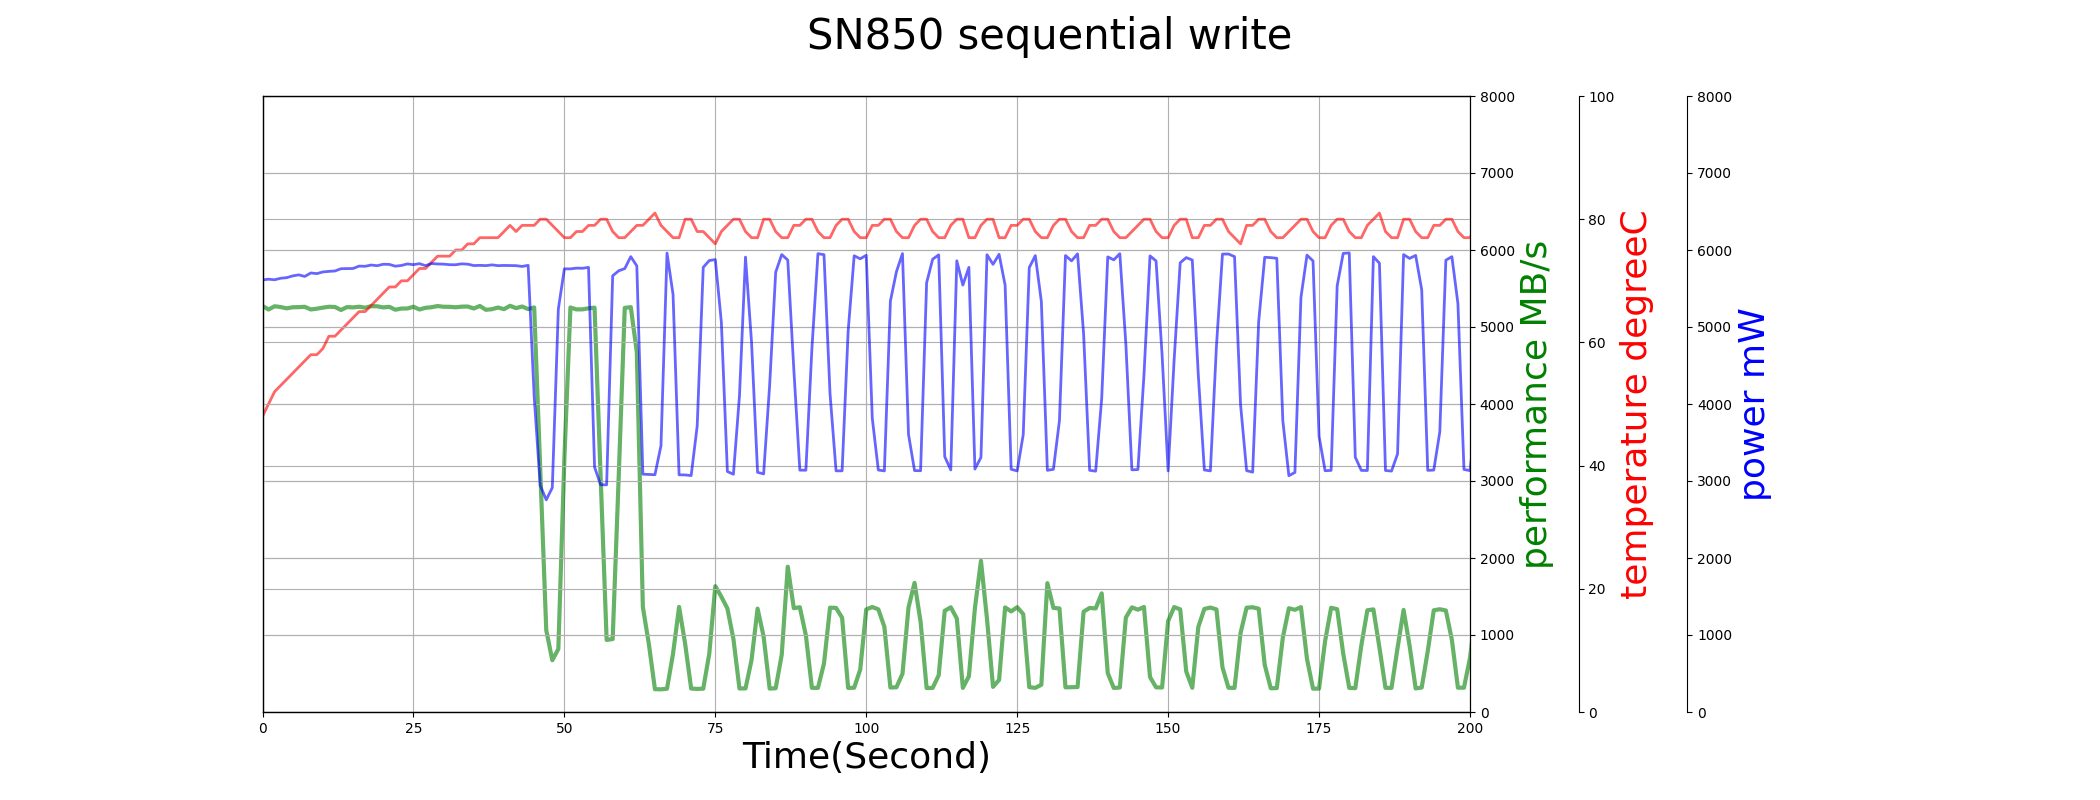

In both sequential write and sequential read test above, the temperature of SN850 rises very fast, and make the performance throttling heavily.
SLC cache retirement
SN850 use the whole capacity as SLC cache. When the drive is young and utilized space is low, it gives user the highest performance. But when the drive is aged (e.g. > 2000 P/E used), we find that SLC cache is retired, and SLC performance lasts very short time.
Reliability
Data Retention
In our whole test process, we will write each DUT to its EOL (about 3000 P/E cycle for TLC SSD), then write the whole drive and keep them without power at the room temperature for 2 month. After that, we read the whole drive and verify its data integrity. Here is the test result.
| Data Units Written (1000LBA) | read speed 0 (MB/s) | read speed 2 (MB/s) | |
|---|---|---|---|
| SN850 | 7506783940 | 4941 | 188 |
| 980Pro | 5542172462 | 6177 | 6345 |
| P5Plus | 3829583393 | 5599 | 5662 |
‘read speed 0’ is captured right after the data was written, and ‘read speed 0’ is captured 2-month later. SN850 was written by much more data intentionally. We check the result of ‘read speed 2’.
We intentionally write SN850 much more than other drives, so SN850 suffers more NAND raw ECC data. But it still can recover all data without any UECC error. The low speed (188MB/s) may be caused by read retry and LDPC decoder.