PyNVMe3 Test Report of Solidigm P41 Plus
| PS4 power consumption mW | PS4 exit latency | TMT1 (℃) | TMT2 (℃) | |
|---|---|---|---|---|
| P41Plus | 138.0 | 18093.8 | 73 | 76 |
| P3Plus | 45.5 | 39794.5 | 81 | 84 |
| SN770 | 15.4 | 10675.6 | 80 | 82 |
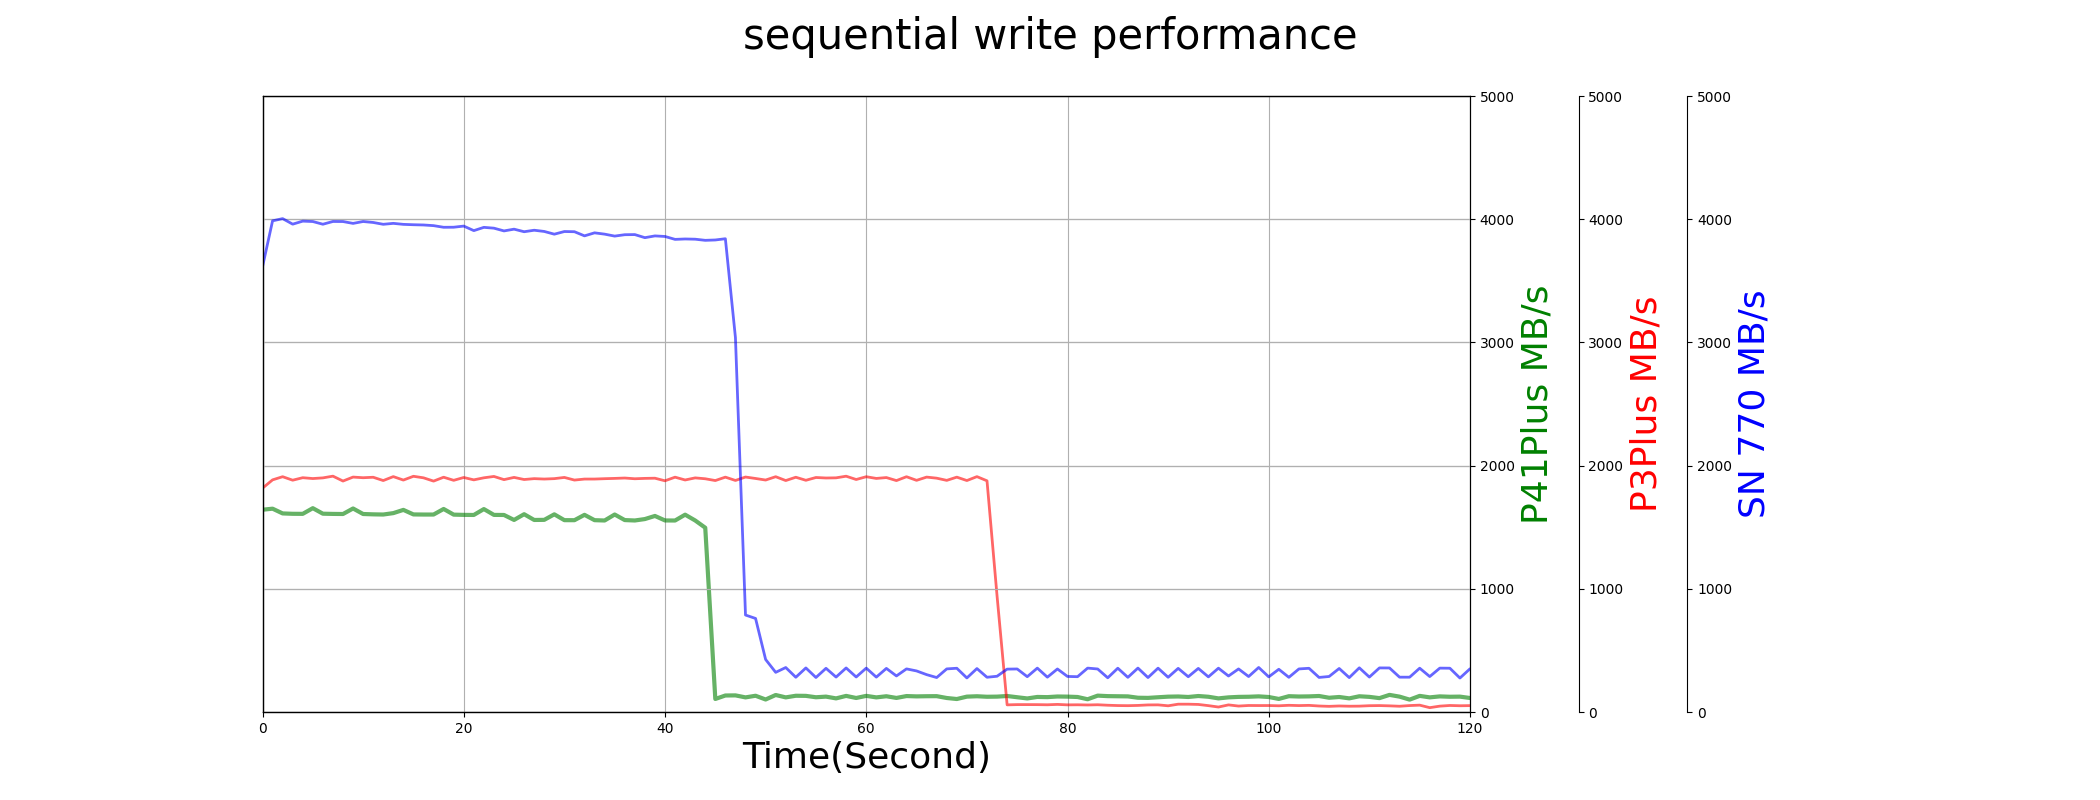
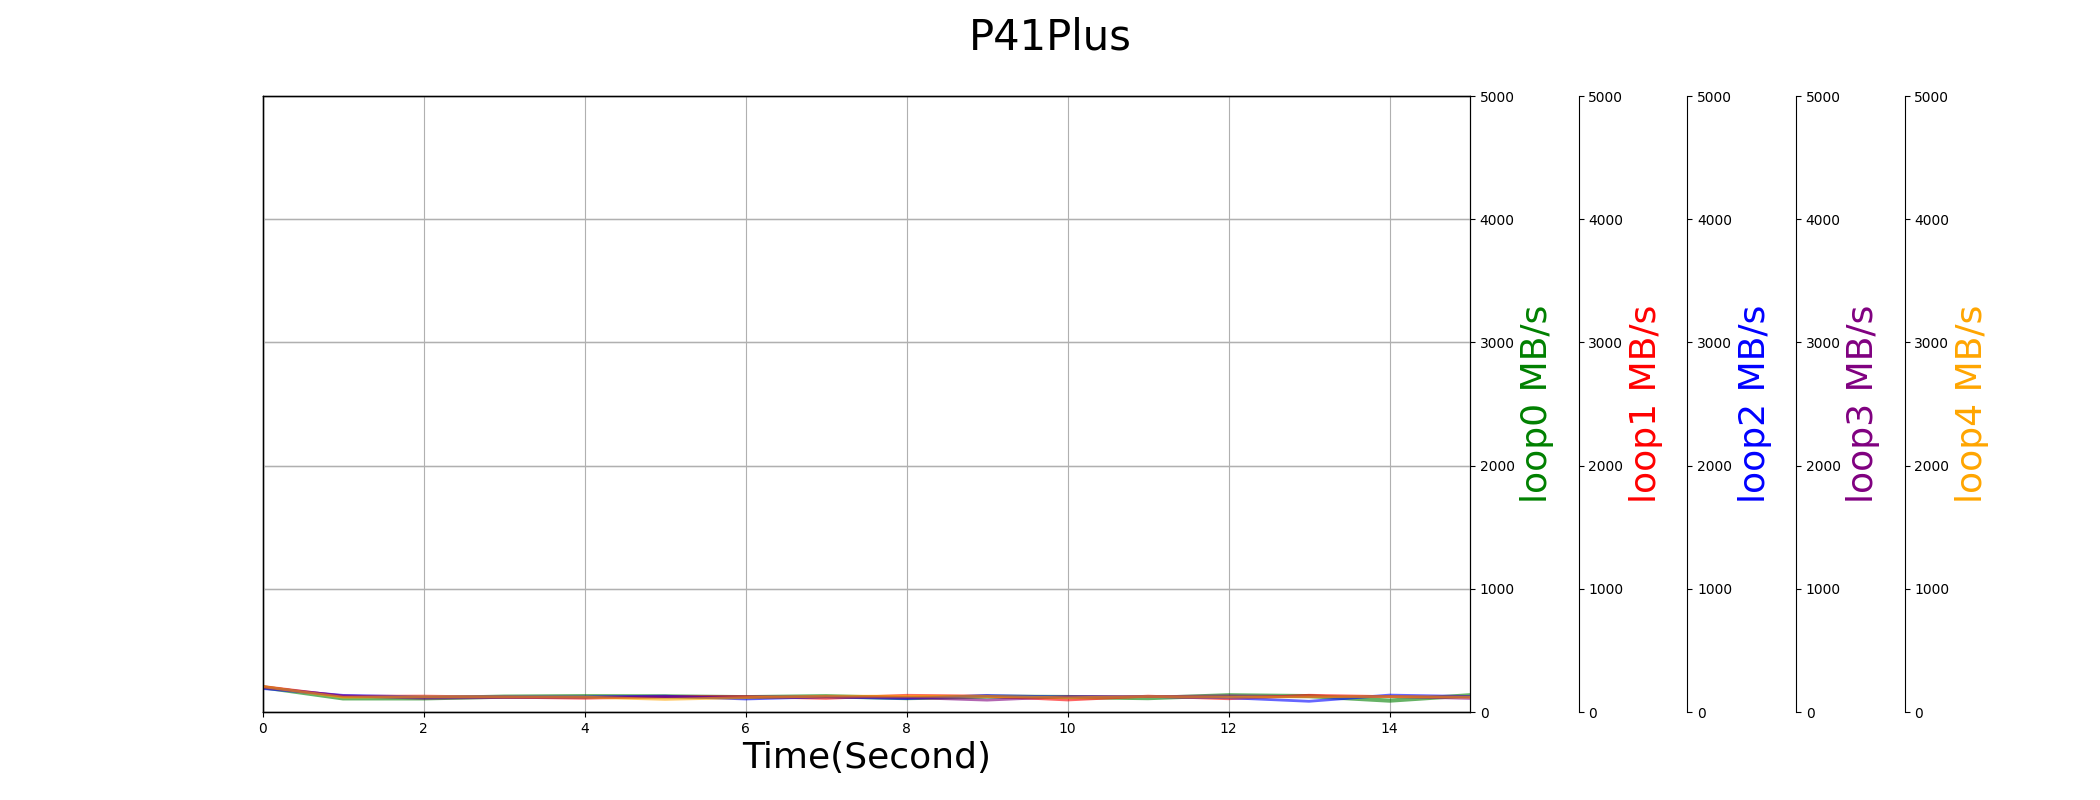
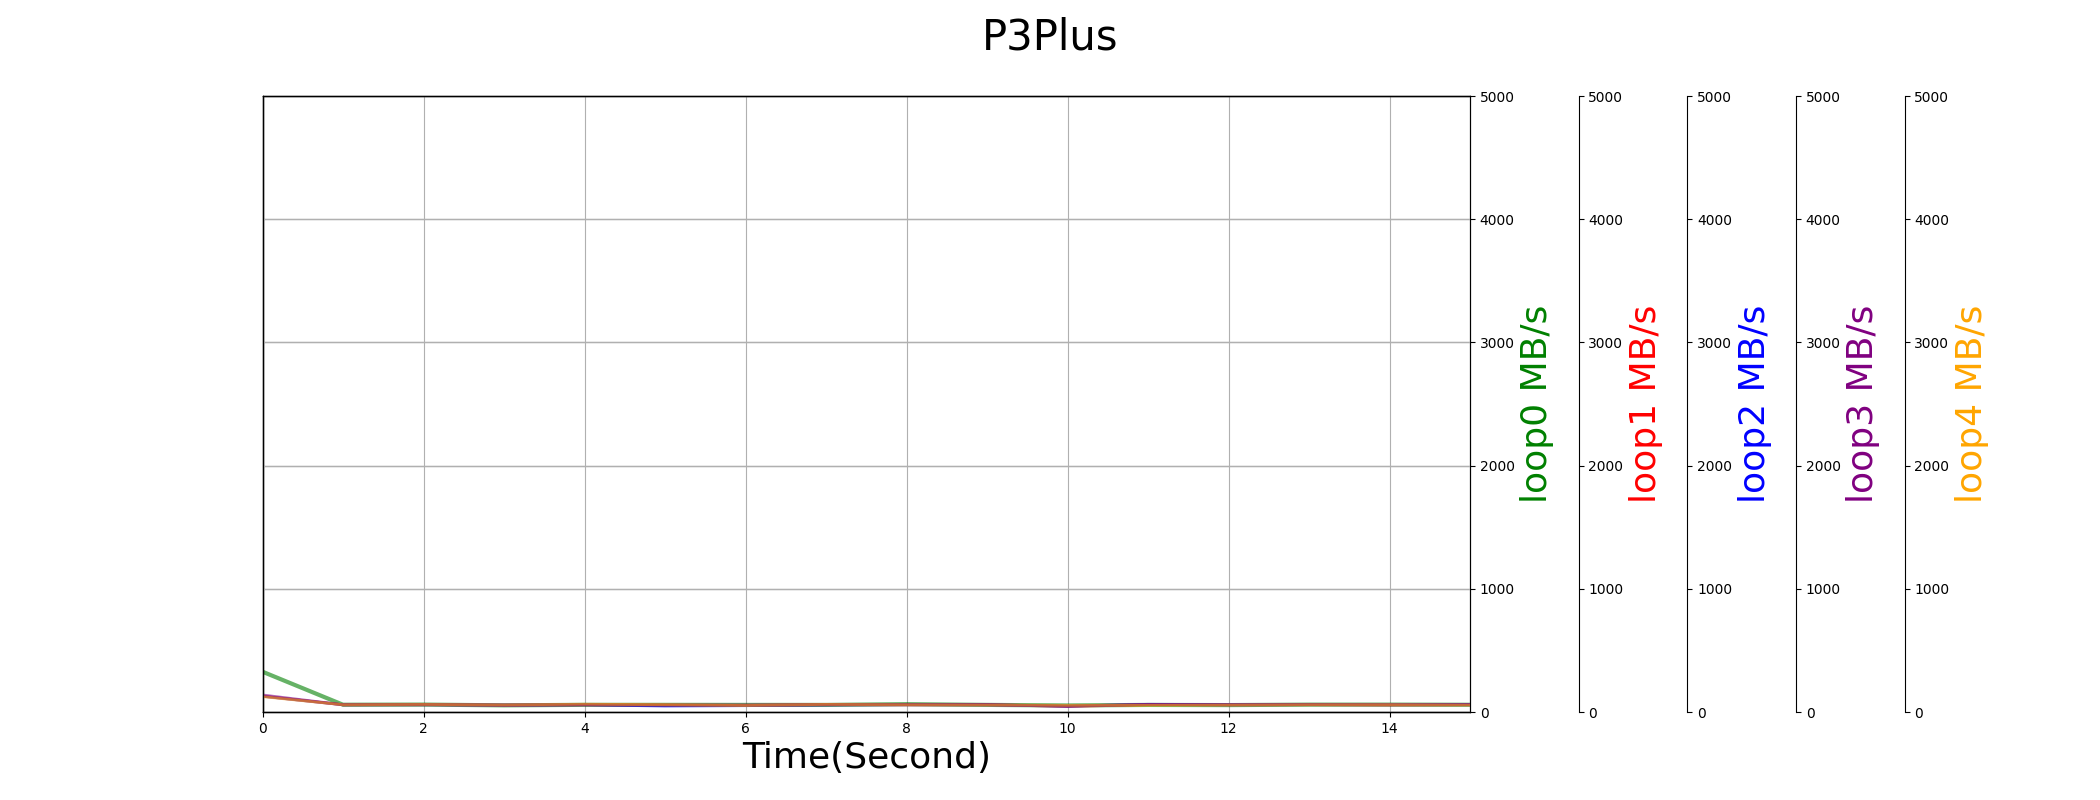
Sequential Write
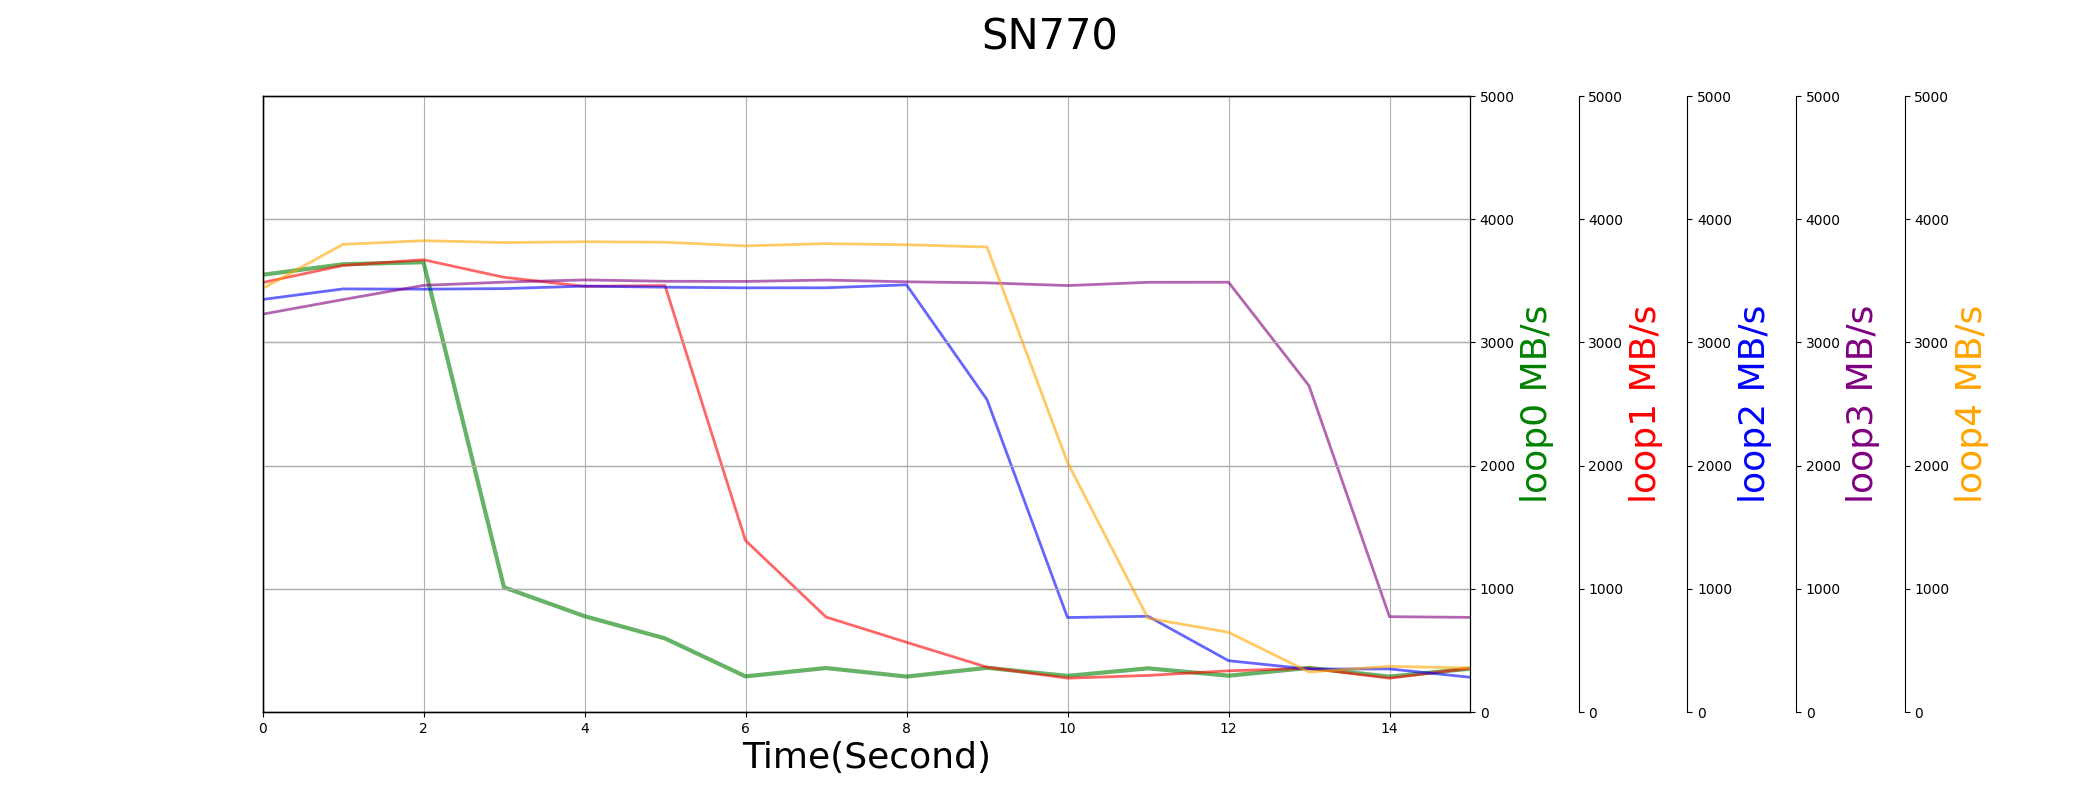
The graph below depicts the performance curve of the P41Plus, P3Plus, and SN770 during a 2-minute write operation under an empty drive condition. Both P41Plus and P3Plus are QLC SSDs, while the SN770 is a TLC SSD. As can be seen, QLC SSDs have much lower write performance than TLC, whether within or outside the SLC cache. The P3Plus uses a full drive SLC cache, and when the SLC cache is depleted, the sequential write performance of the P3Plus drops to around 50MB/s.
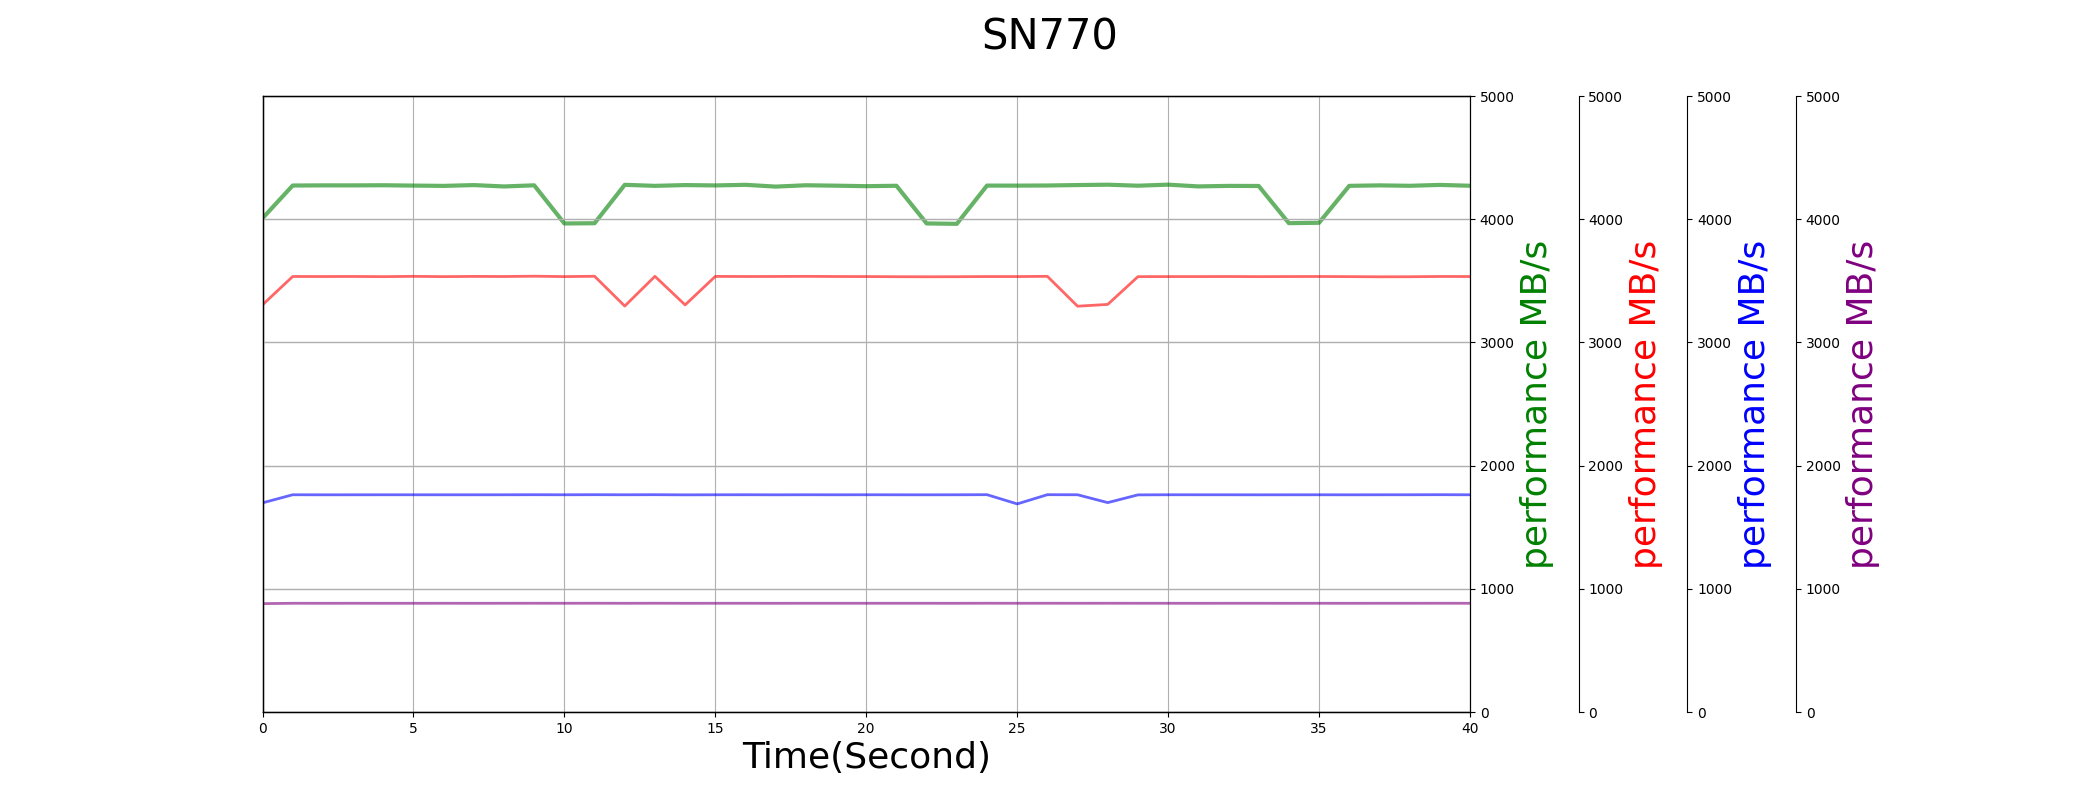
The graph below shows the read performance of the P41Plus under PCIe Gen4 to Gen1. As can be observed, its performance hits a bottleneck at Gen3, and Gen4 PCIe doesn’t provide any improvements.
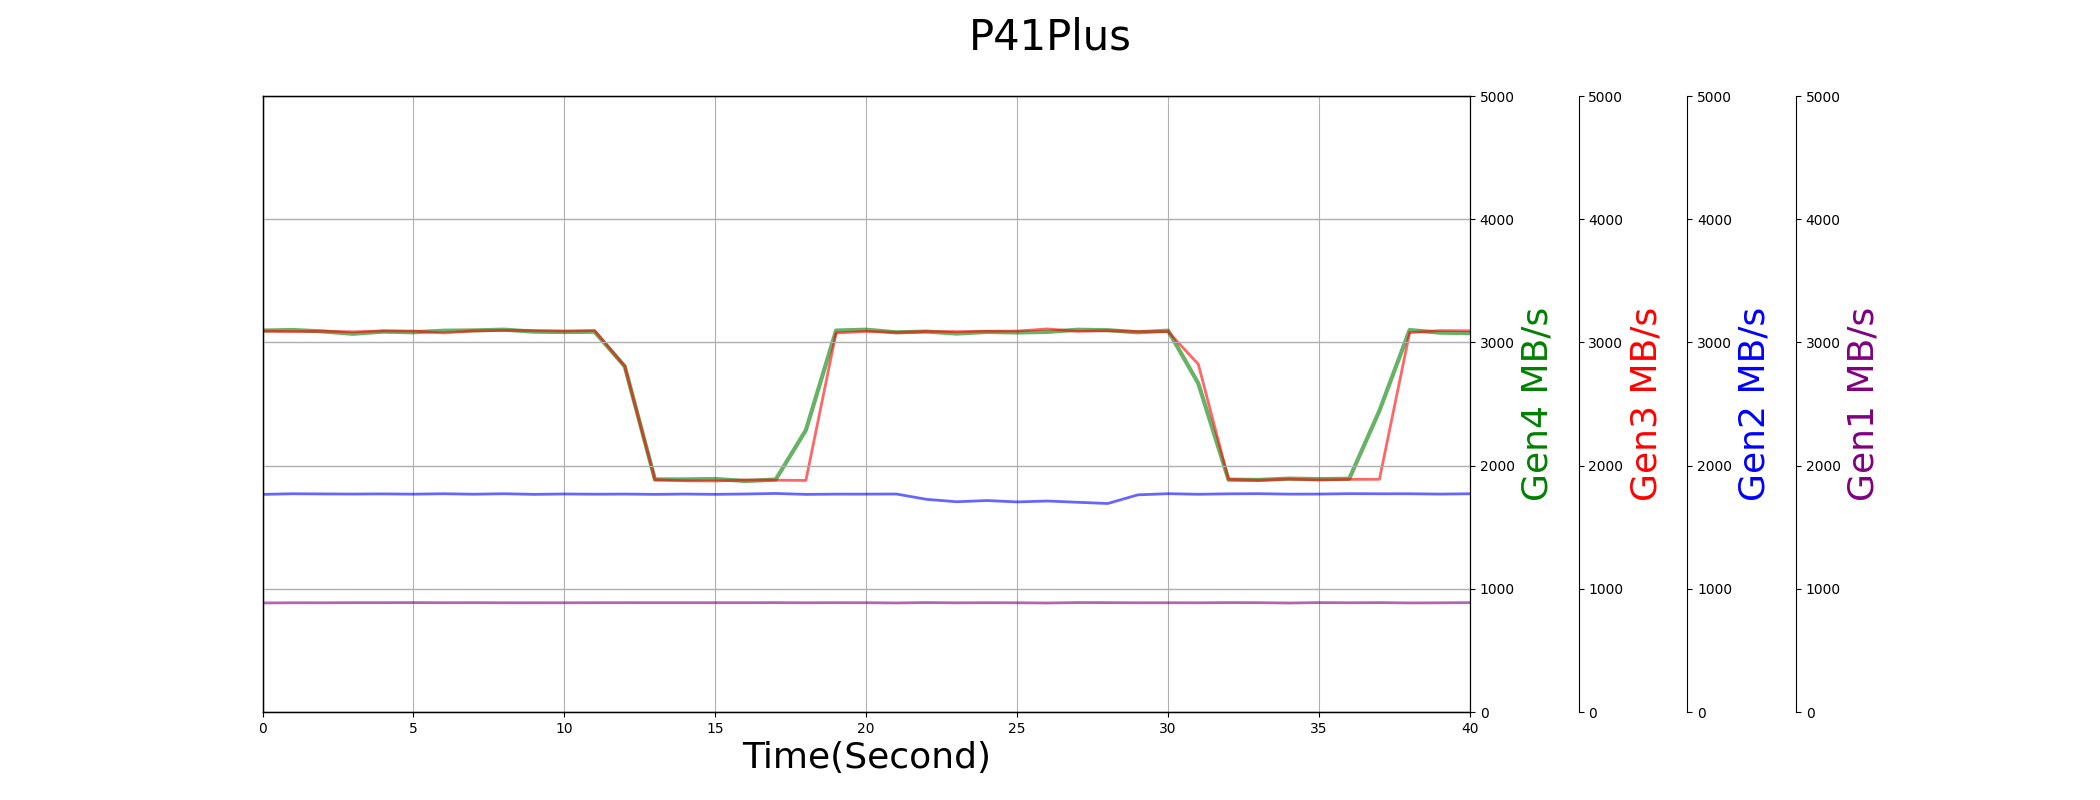
The Gen4 performance of the P3Plus is not significantly higher than that of Gen3.
We should not hold overly high expectations for PCIe Gen5; it’s designed for data center use. In personal use scenarios, PCIe Gen5 may not necessarily bring much performance improvement.
In terms of sequential read and write performance, the P41Plus can achieve half the performance of the SN770; however, the discrepancy is greater in terms of random performance. If we consider other metrics such as mixed performance, trim performance or latency, the difference between the two can be an order of magnitude.
| seq read MB/s | seq write MB/s | random write K IOPS | readom read K IOPS | |
|---|---|---|---|---|
| P41Plus | 2735.527 | 1250.324 | 37.914 | 9.539 |
| SN770 | 5062.608 | 3194.970 | 110.502 | 24.376 |
| read/write mixed K IOPS | all IO mixed K IOPS | rwmix 99% Latency (ms) | 1QD 512 write maxLatency (ms) | |
|---|---|---|---|---|
| P41Plus | 8.785 | 0.872 | 135.426 | 207.984 |
| SN770 | 90.504 | 8.467 | 11.400 | 8.751 |
| trim IOPS (K) | trim Average Latency (ms) | performance before trim (MB/s) | performance after trim (MB/s) | |
|---|---|---|---|---|
| P41Plus | 0.470 | 34.052 | 99.082 | 1199.213 |
| SN770 | 4.494 | 3.554 | 899.344 | 1818.023 |
After a period of idleness, it is almost impossible to observe the SLC cache being released in both the P41Plus and P3Plus.
With the consumption of disk space and PE, the read and write performance of the P41Plus shows some decline. The performance decay of the P3Plus is even more noticeable.
| P41Plus | sequential write MB/s | sequential read MB/s |
|---|---|---|
| PE100 | 140 | 2414 |
| PE200 | 122 | 2116 |
| PE300 | 113 | N/A |
| PE400 | 112 | 2101 |
| P3Plus | sequential write MB/s | sequential read MB/s |
|---|---|---|
| PE100 | 333 | 2487 |
| PE200 | 75 | 1009 |
| PE300 | 70 | 1078 |
| PE400 | 72 | 1882 |
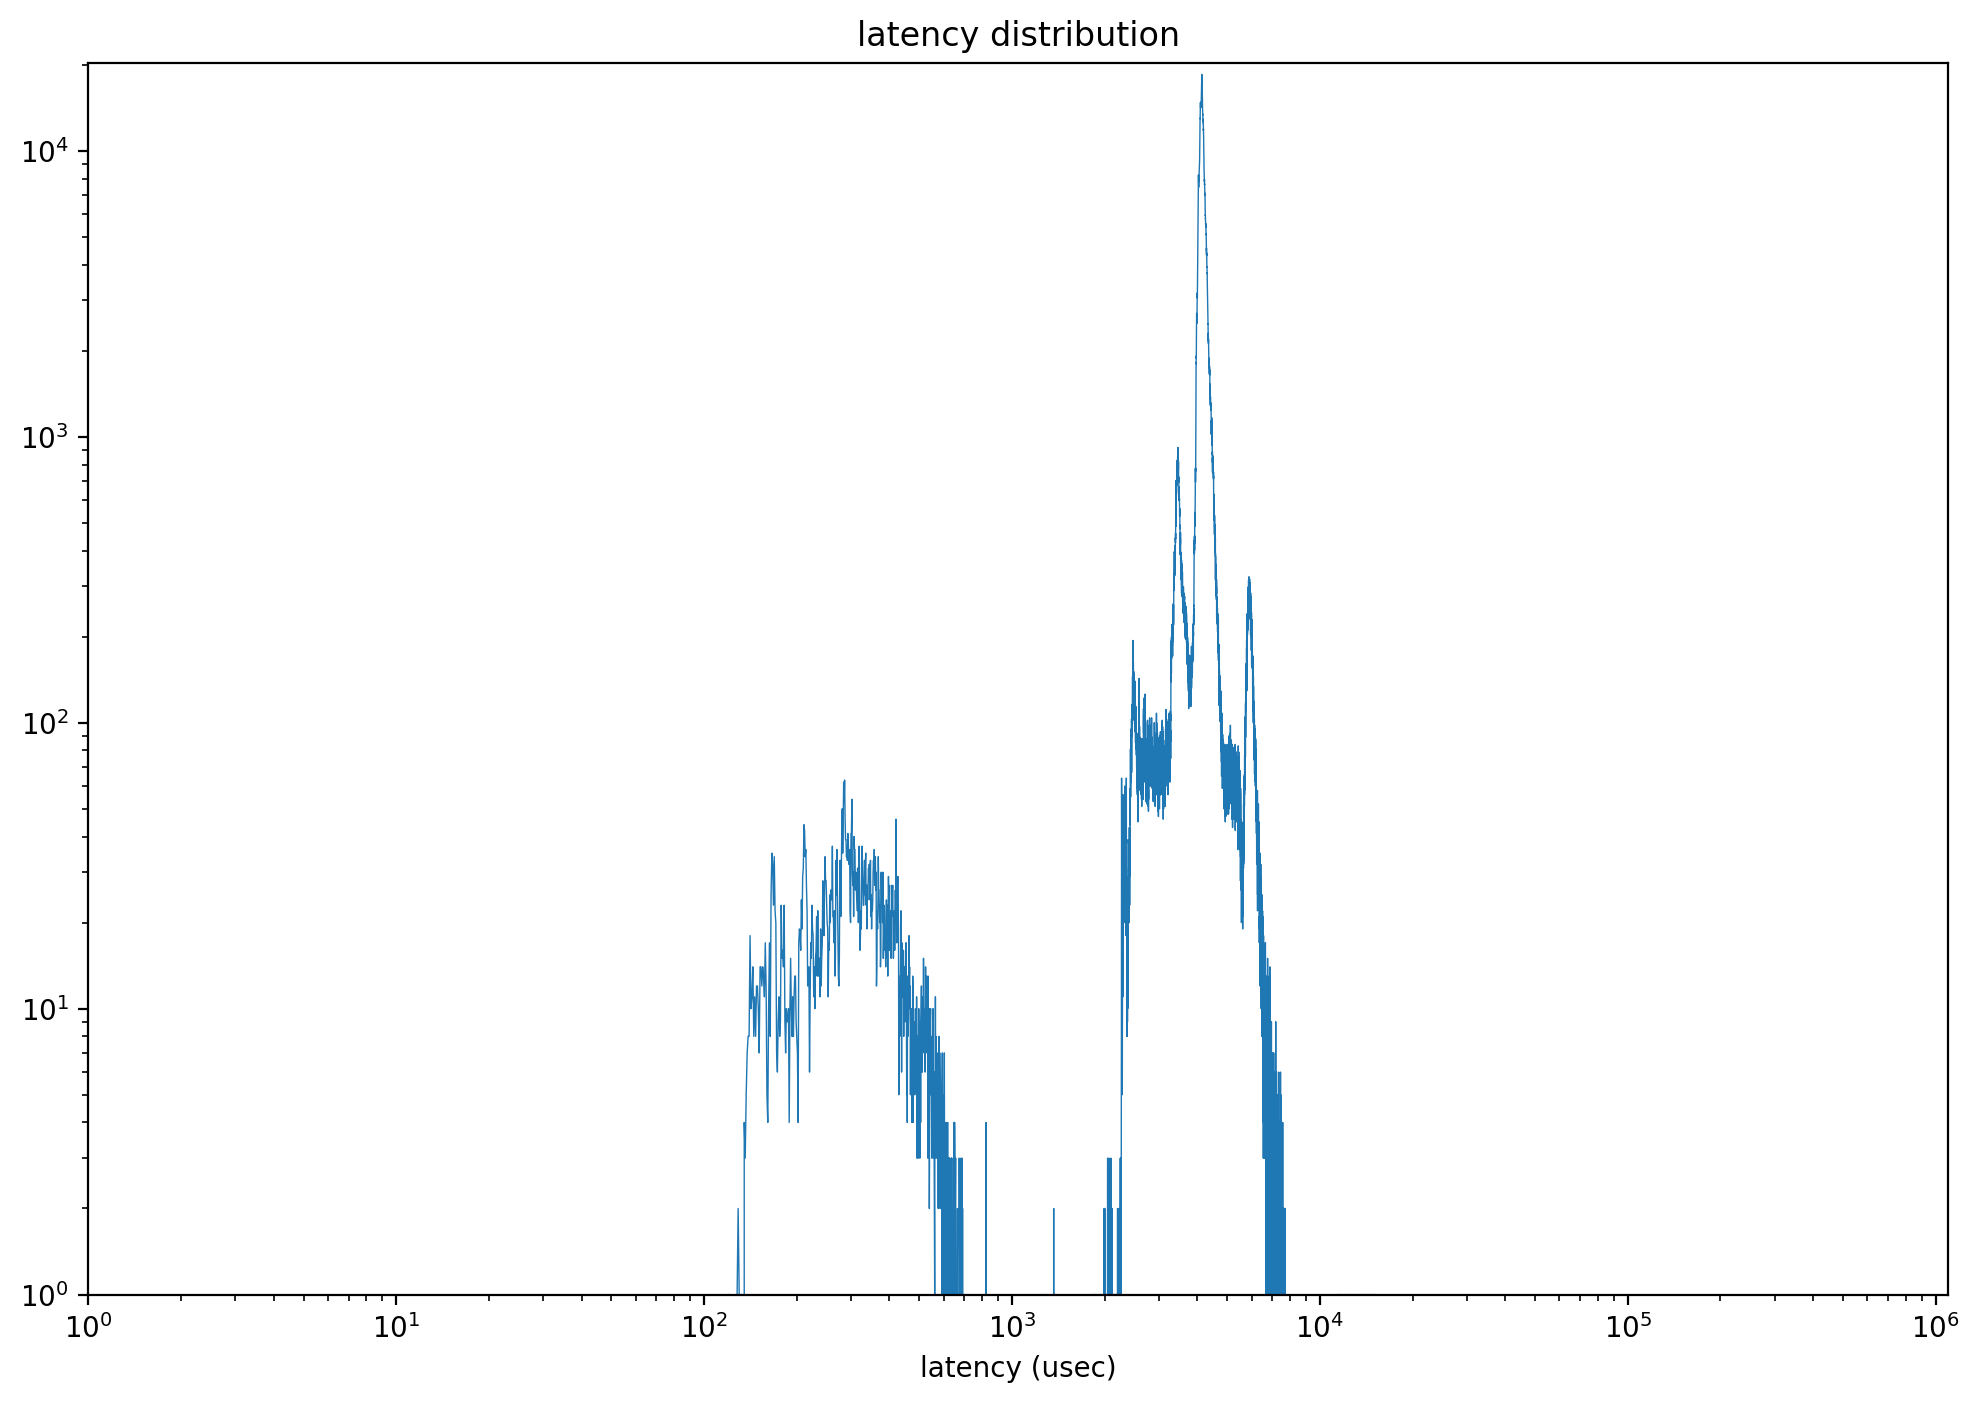
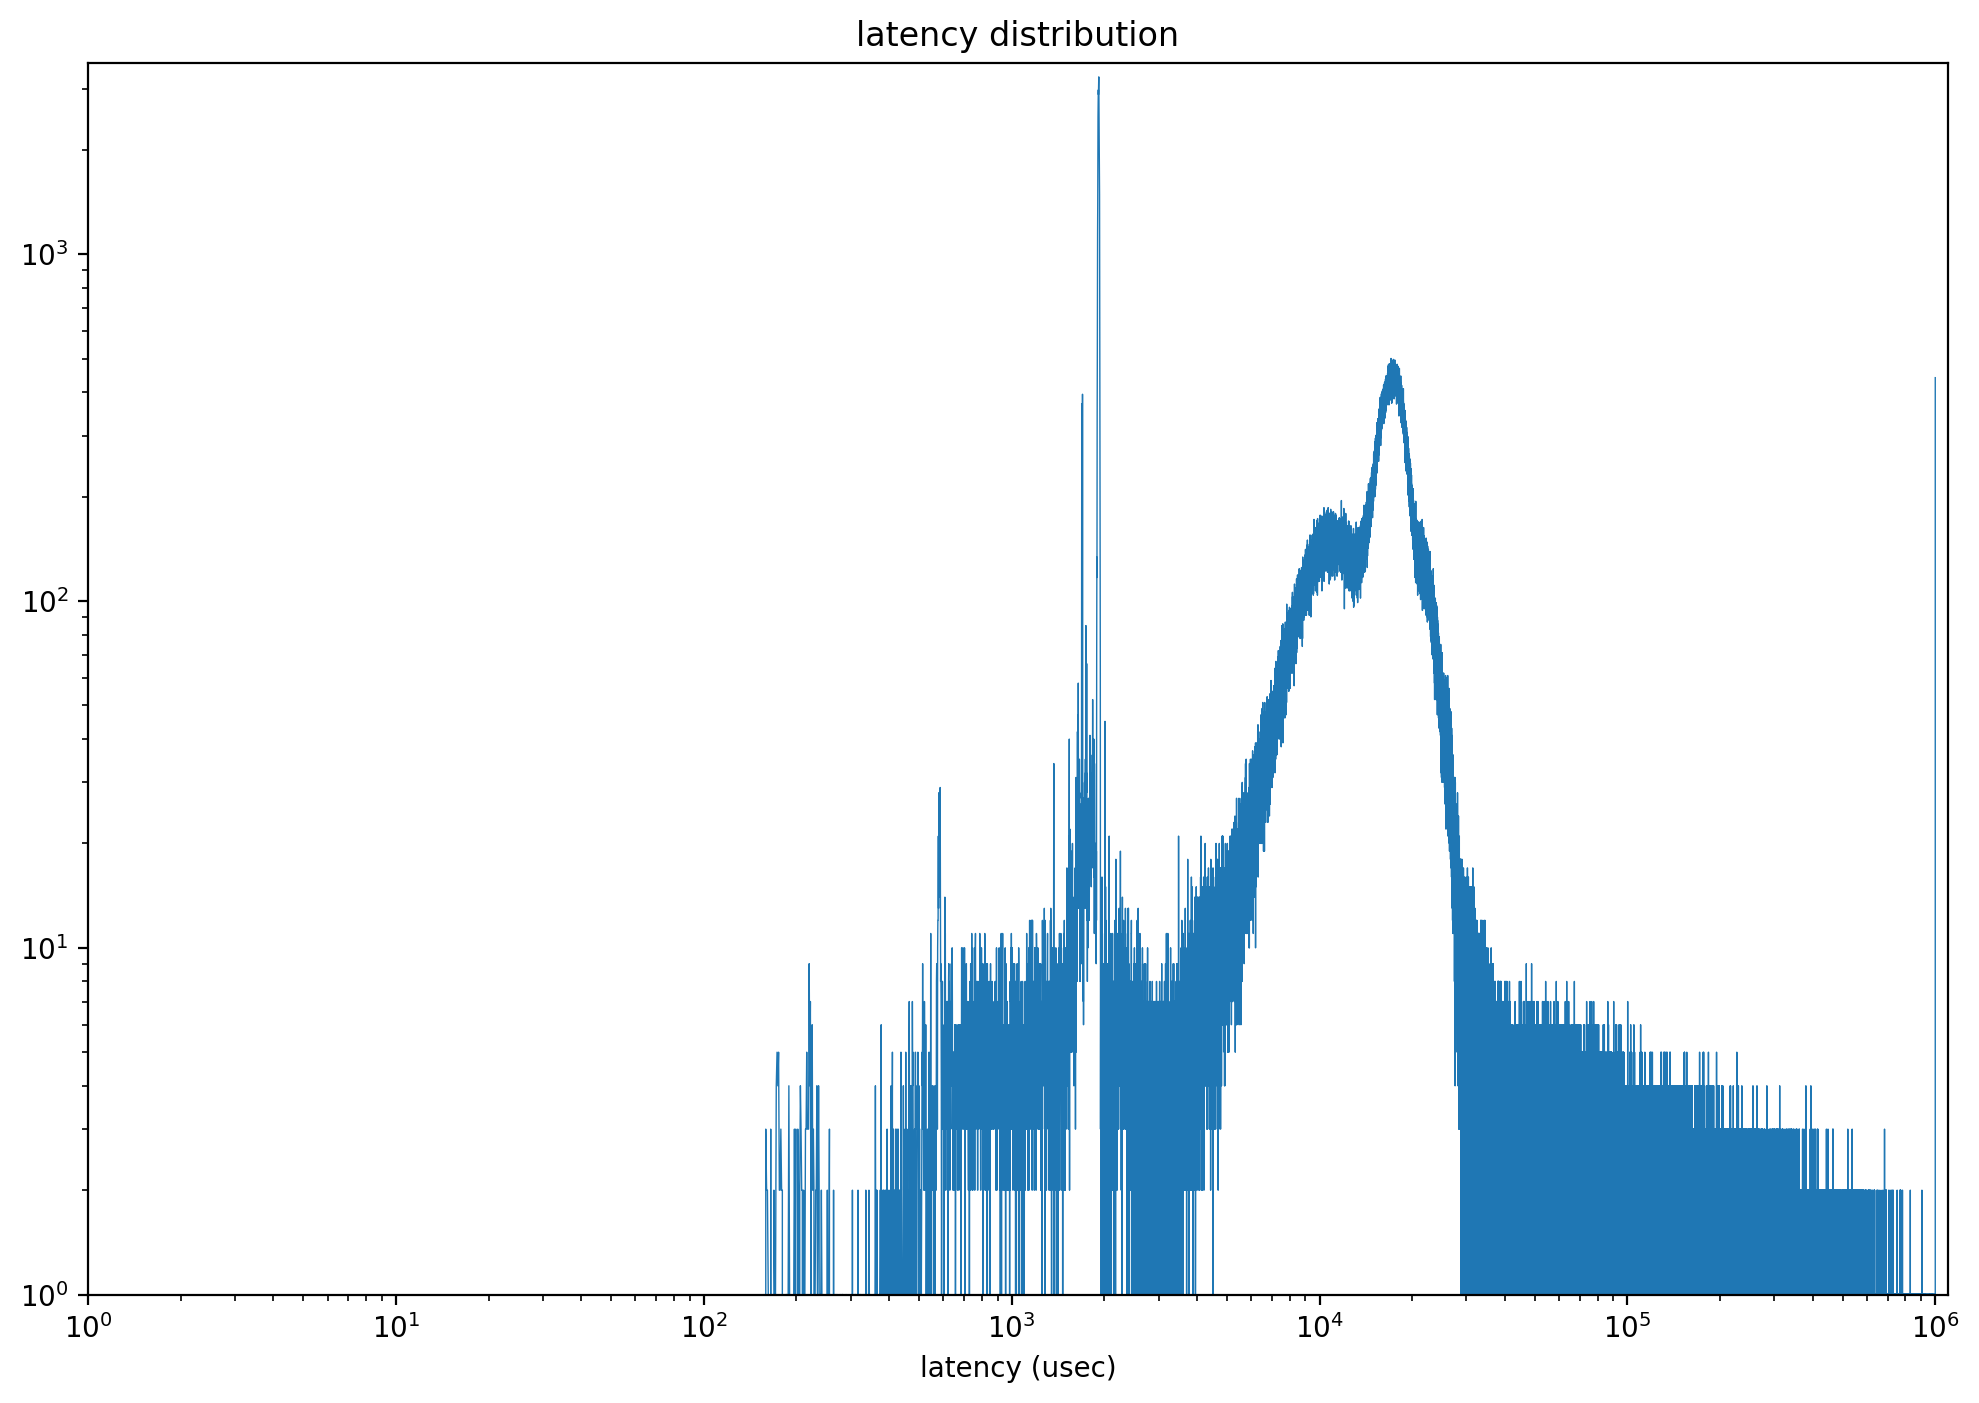
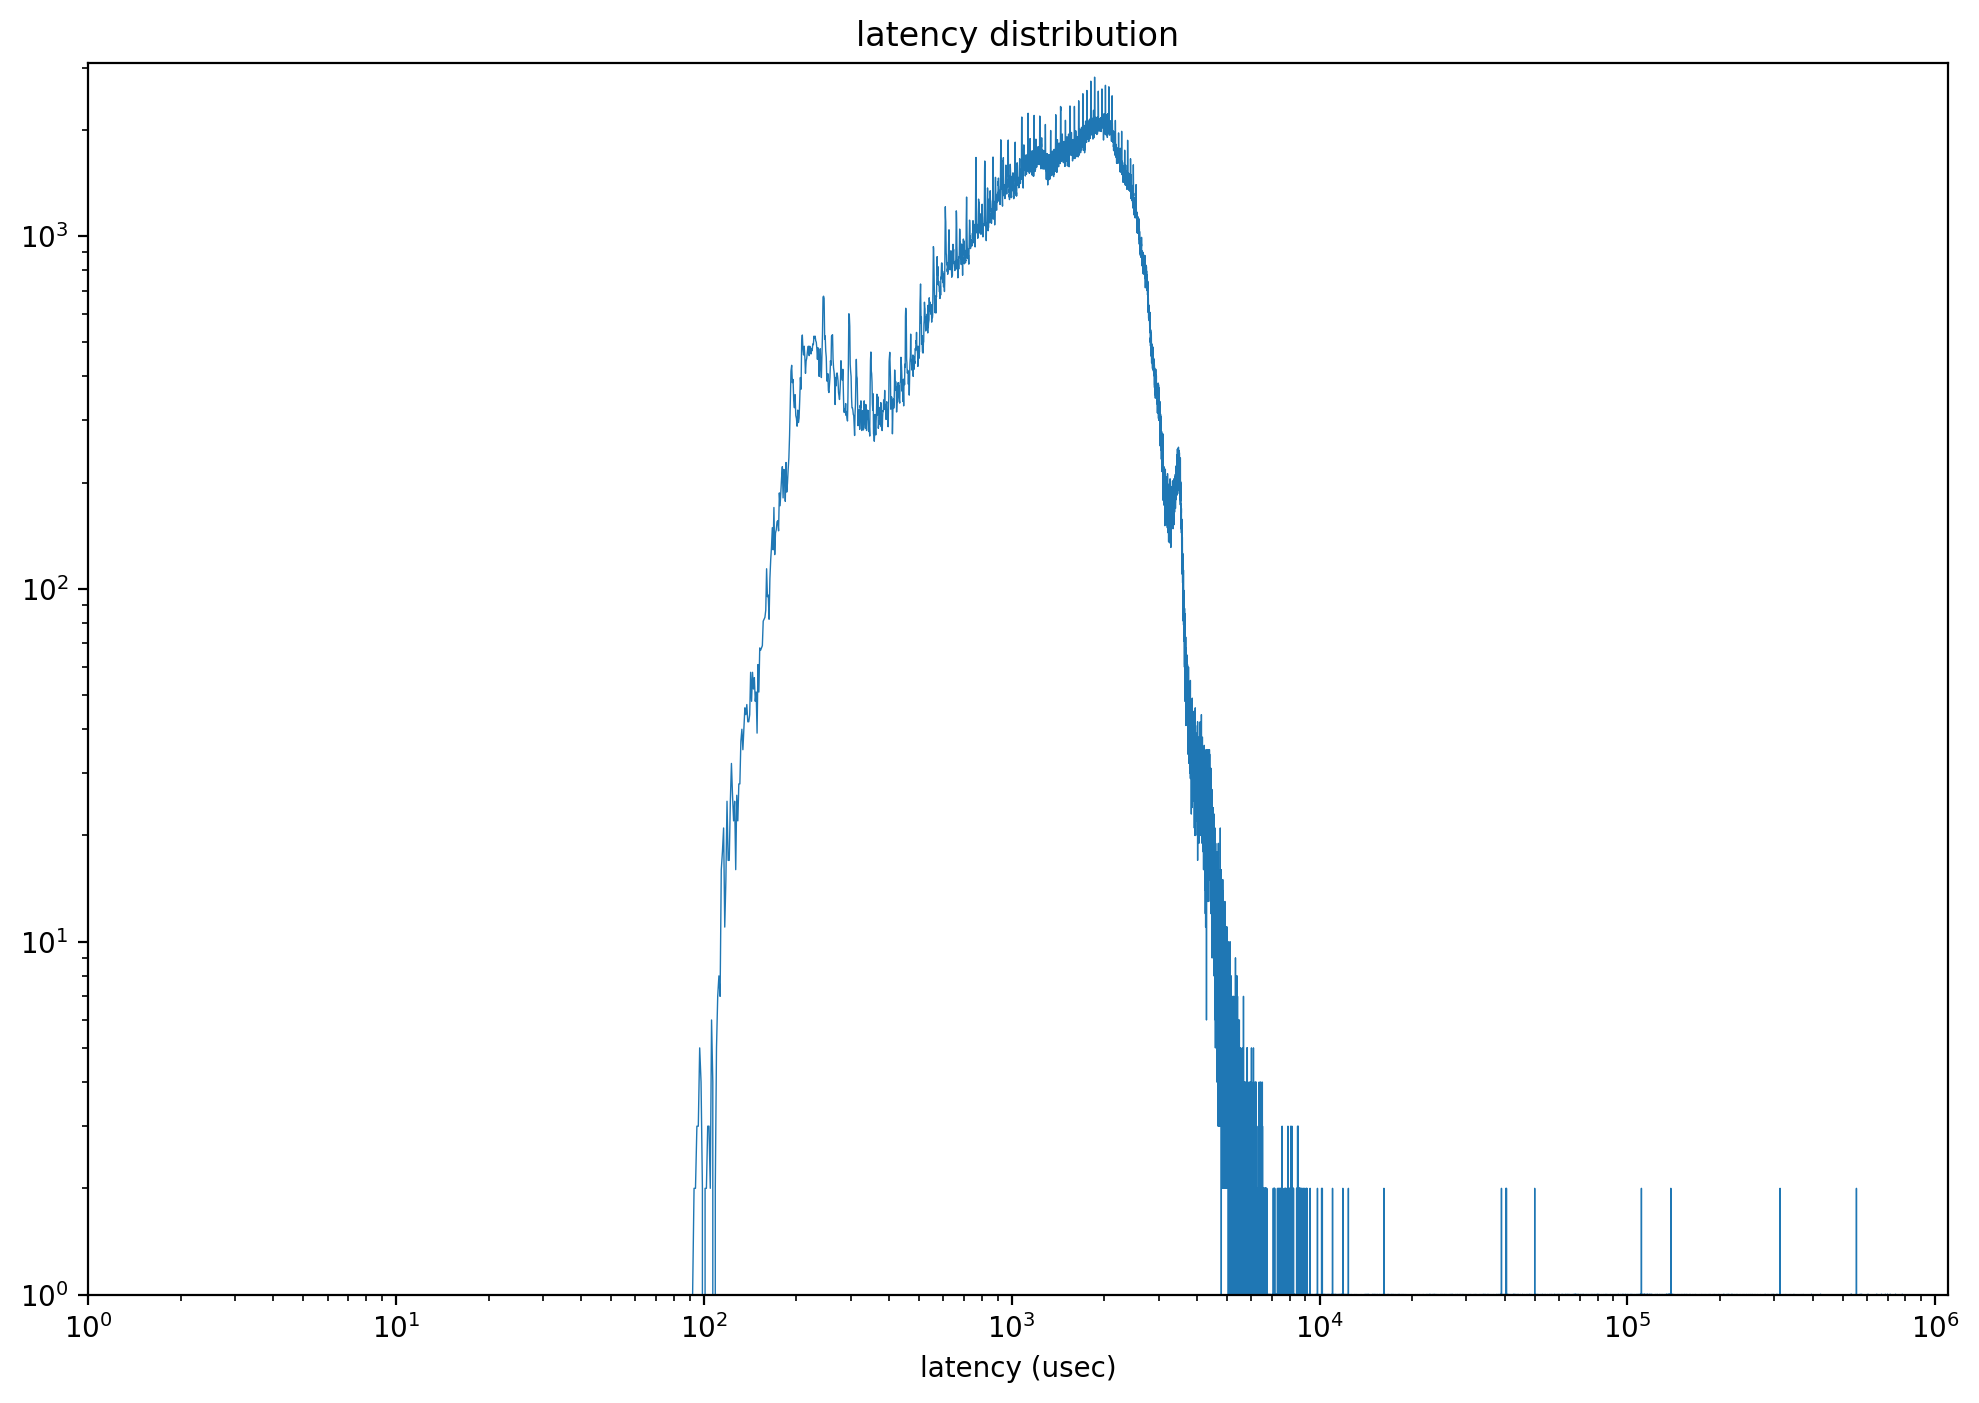
In terms of latency, the two QLC SSDs demonstrate more frequent and lengthier delays. Particularly for the P3Plus, after being powered off for two months, a significant number of read IOs exhibit latencies exceeding 100ms, with a few even surpassing 1 second. Such performance will undoubtedly affect the user experience.
| Write Latency Distribution | Read Latency Distribution (after 2-month) | |
|---|---|---|
| P41Plus | 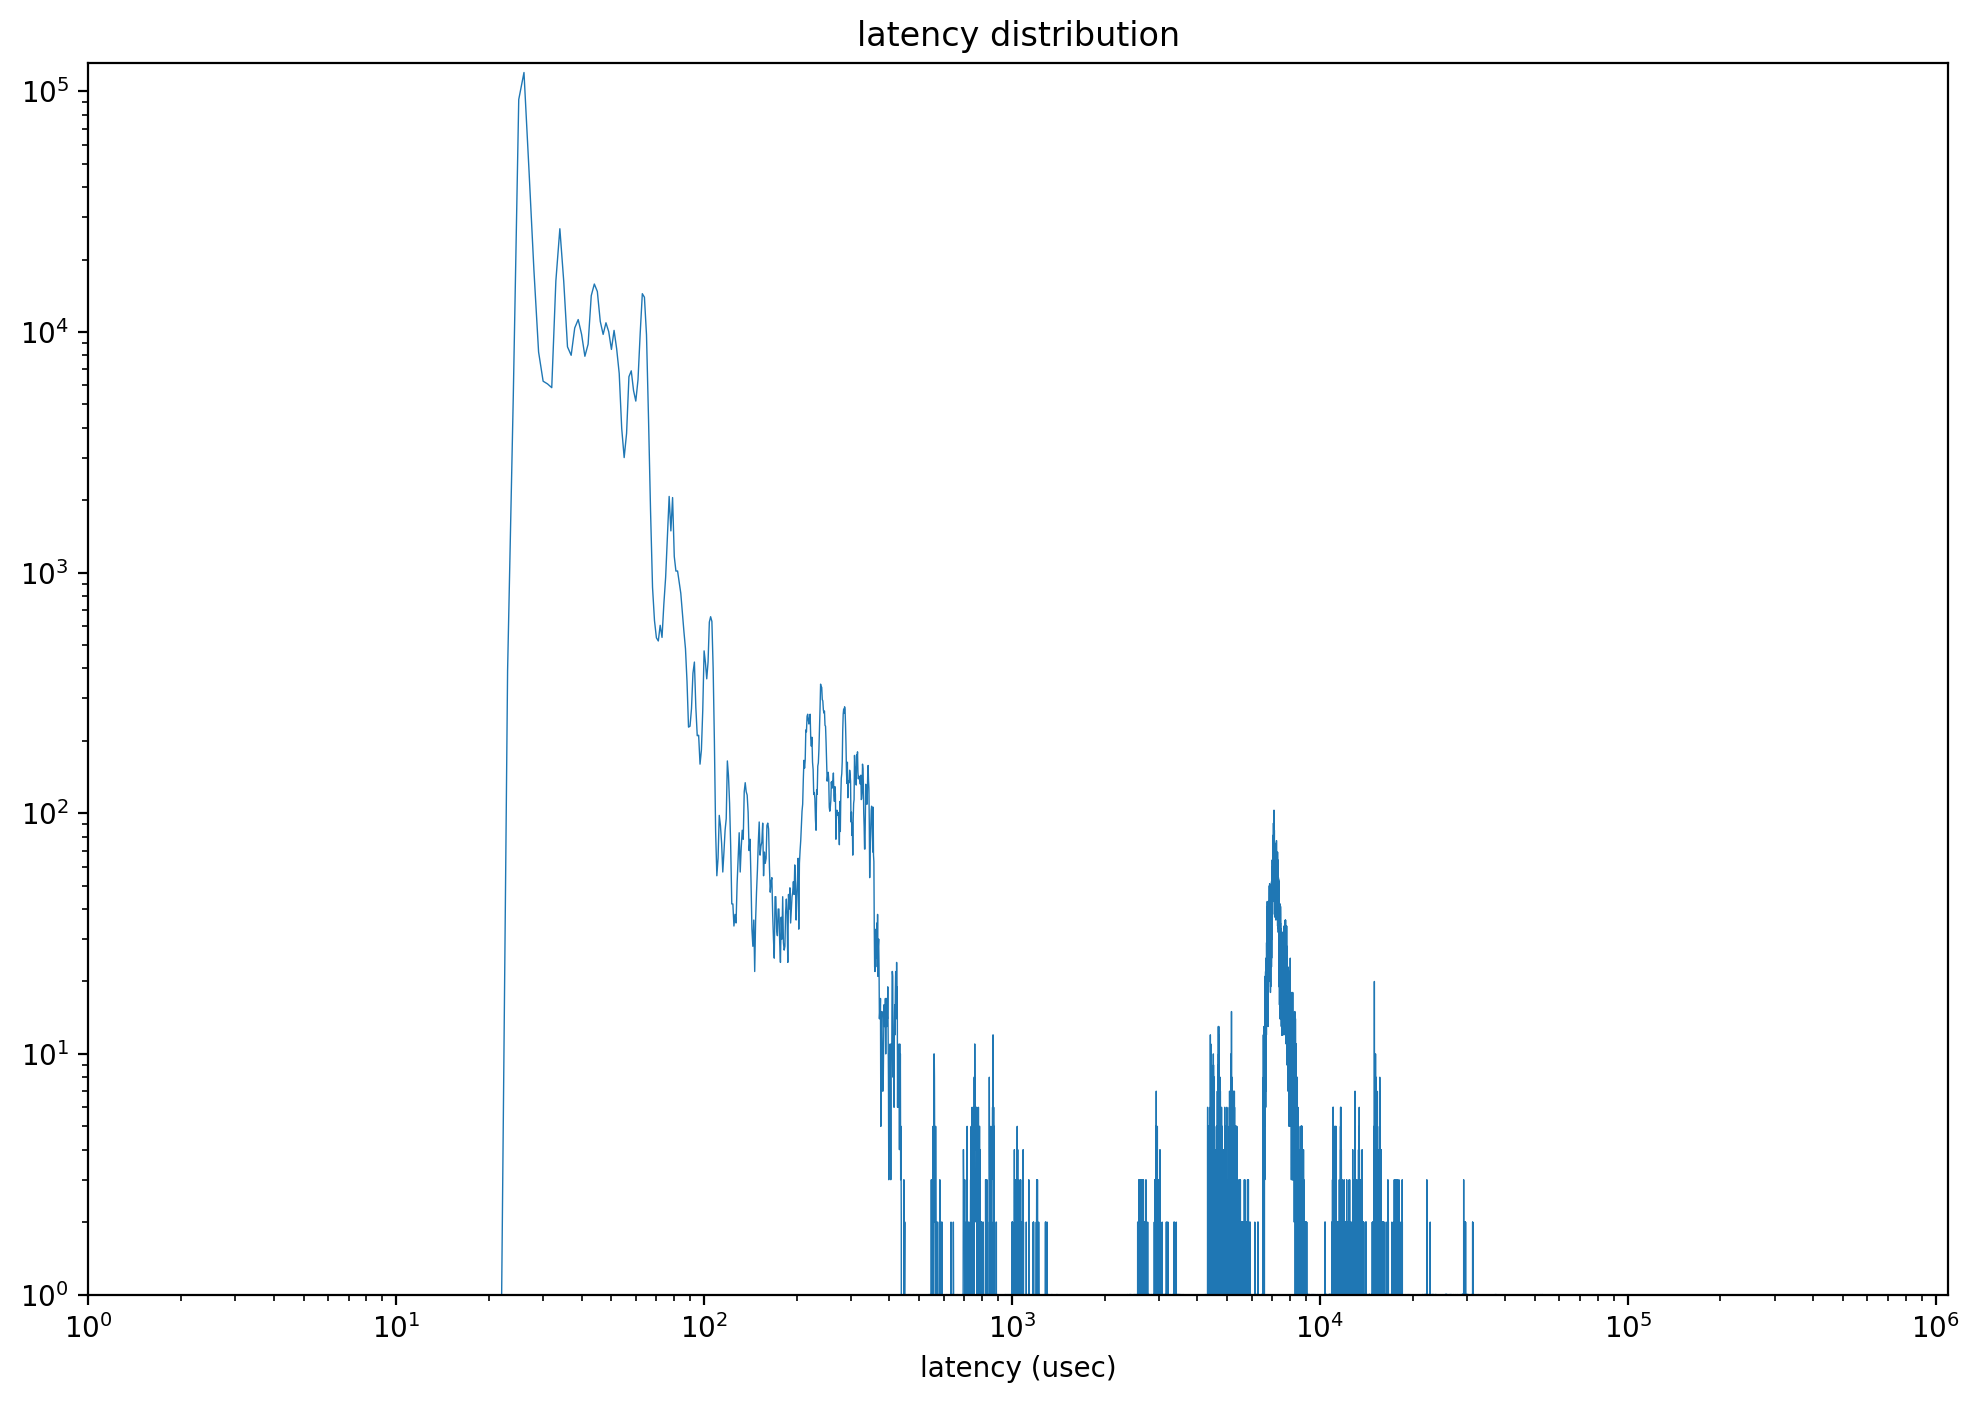 |
 |
| P3Plus | 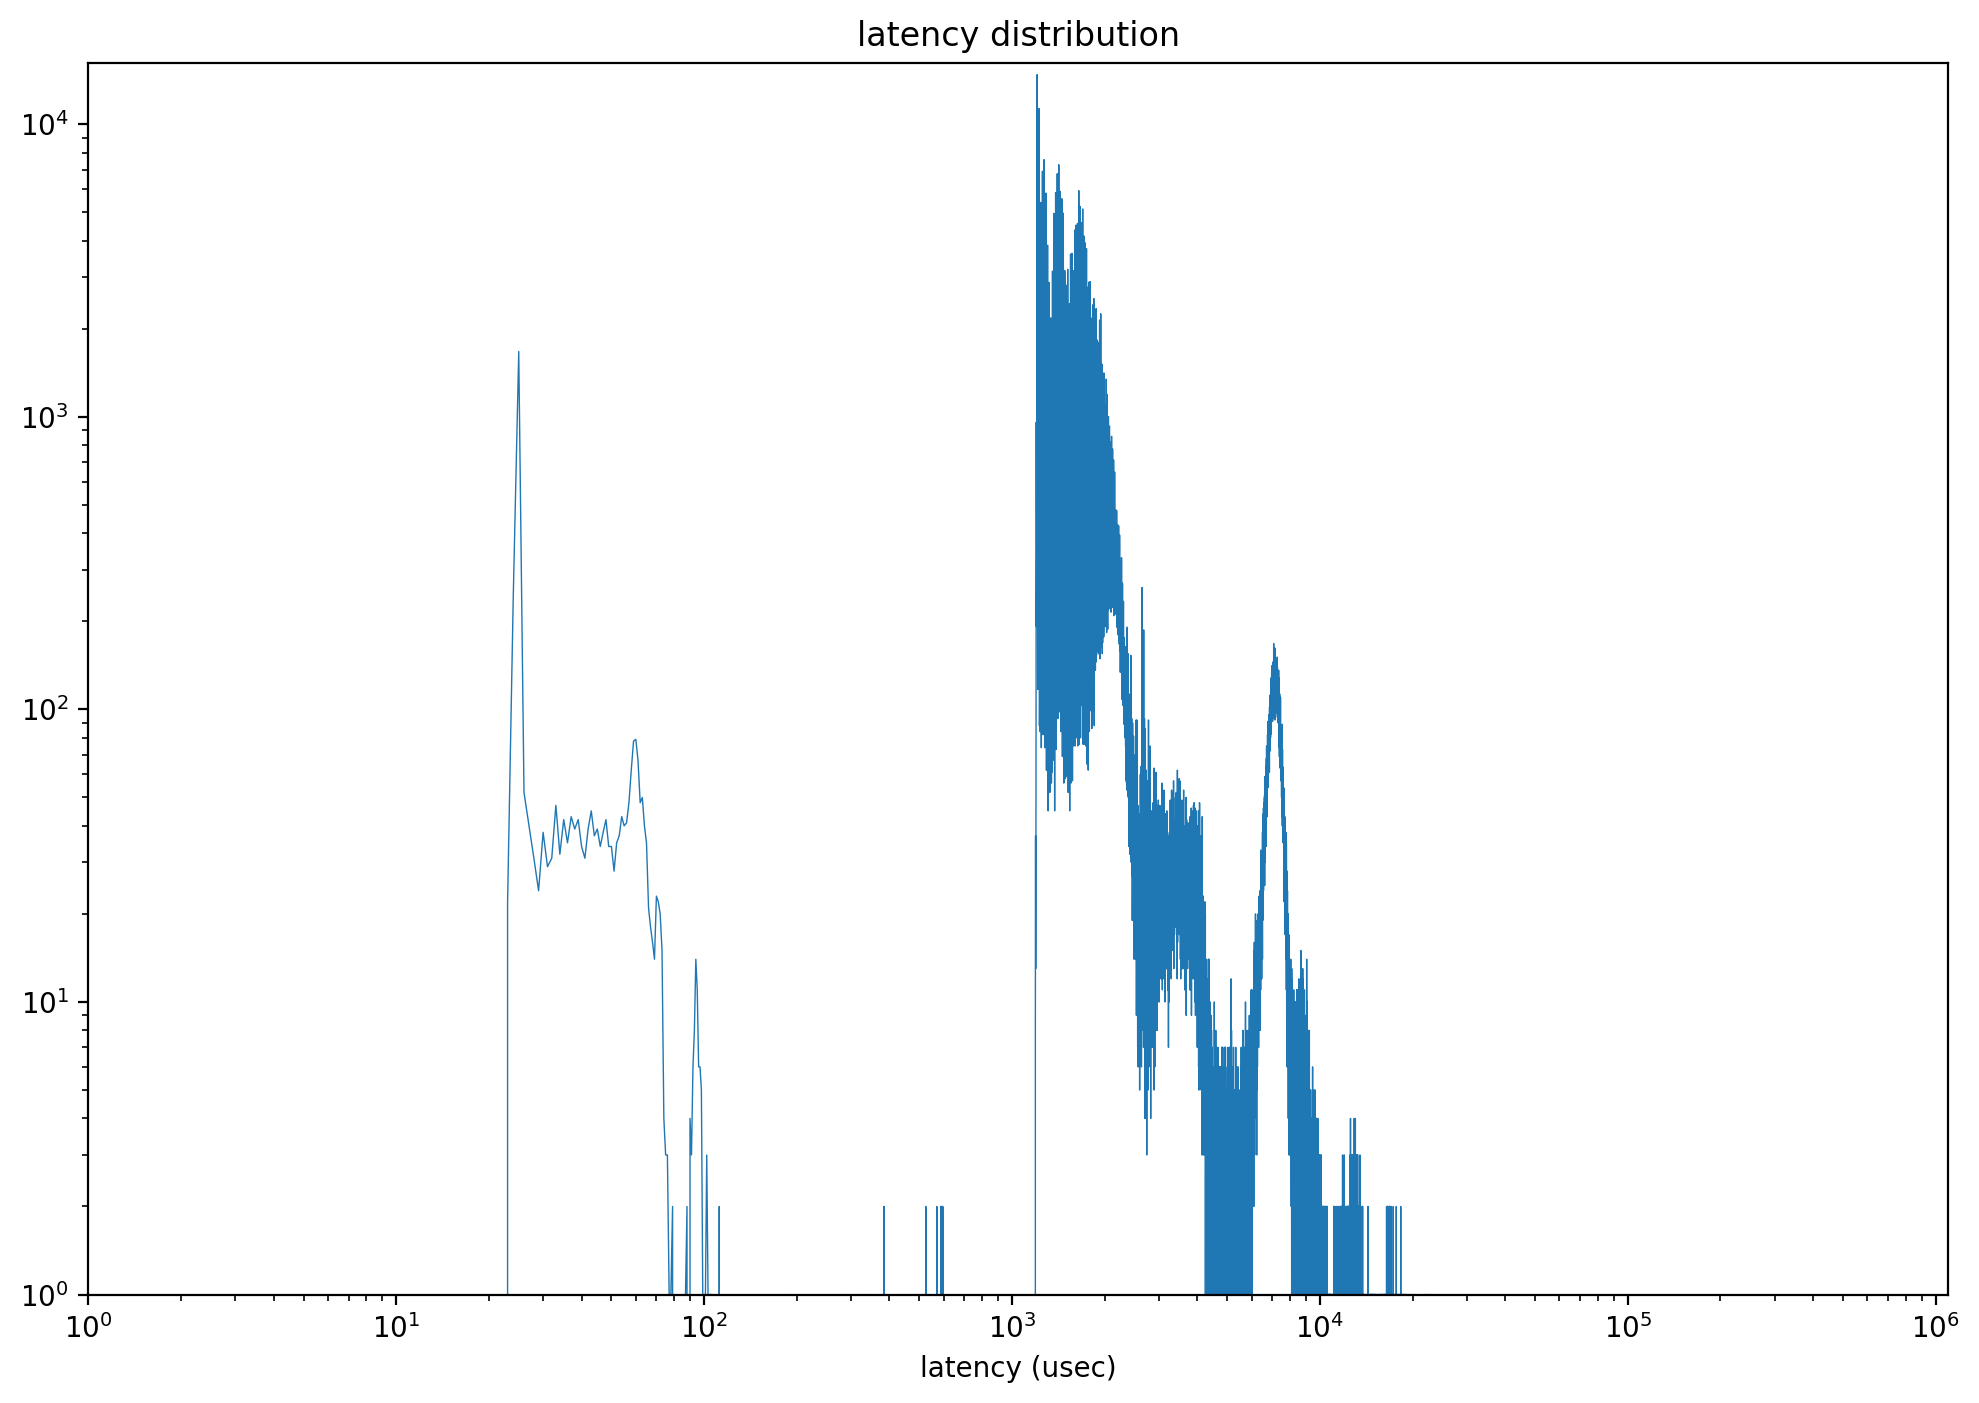 |
 |
| SN770 | 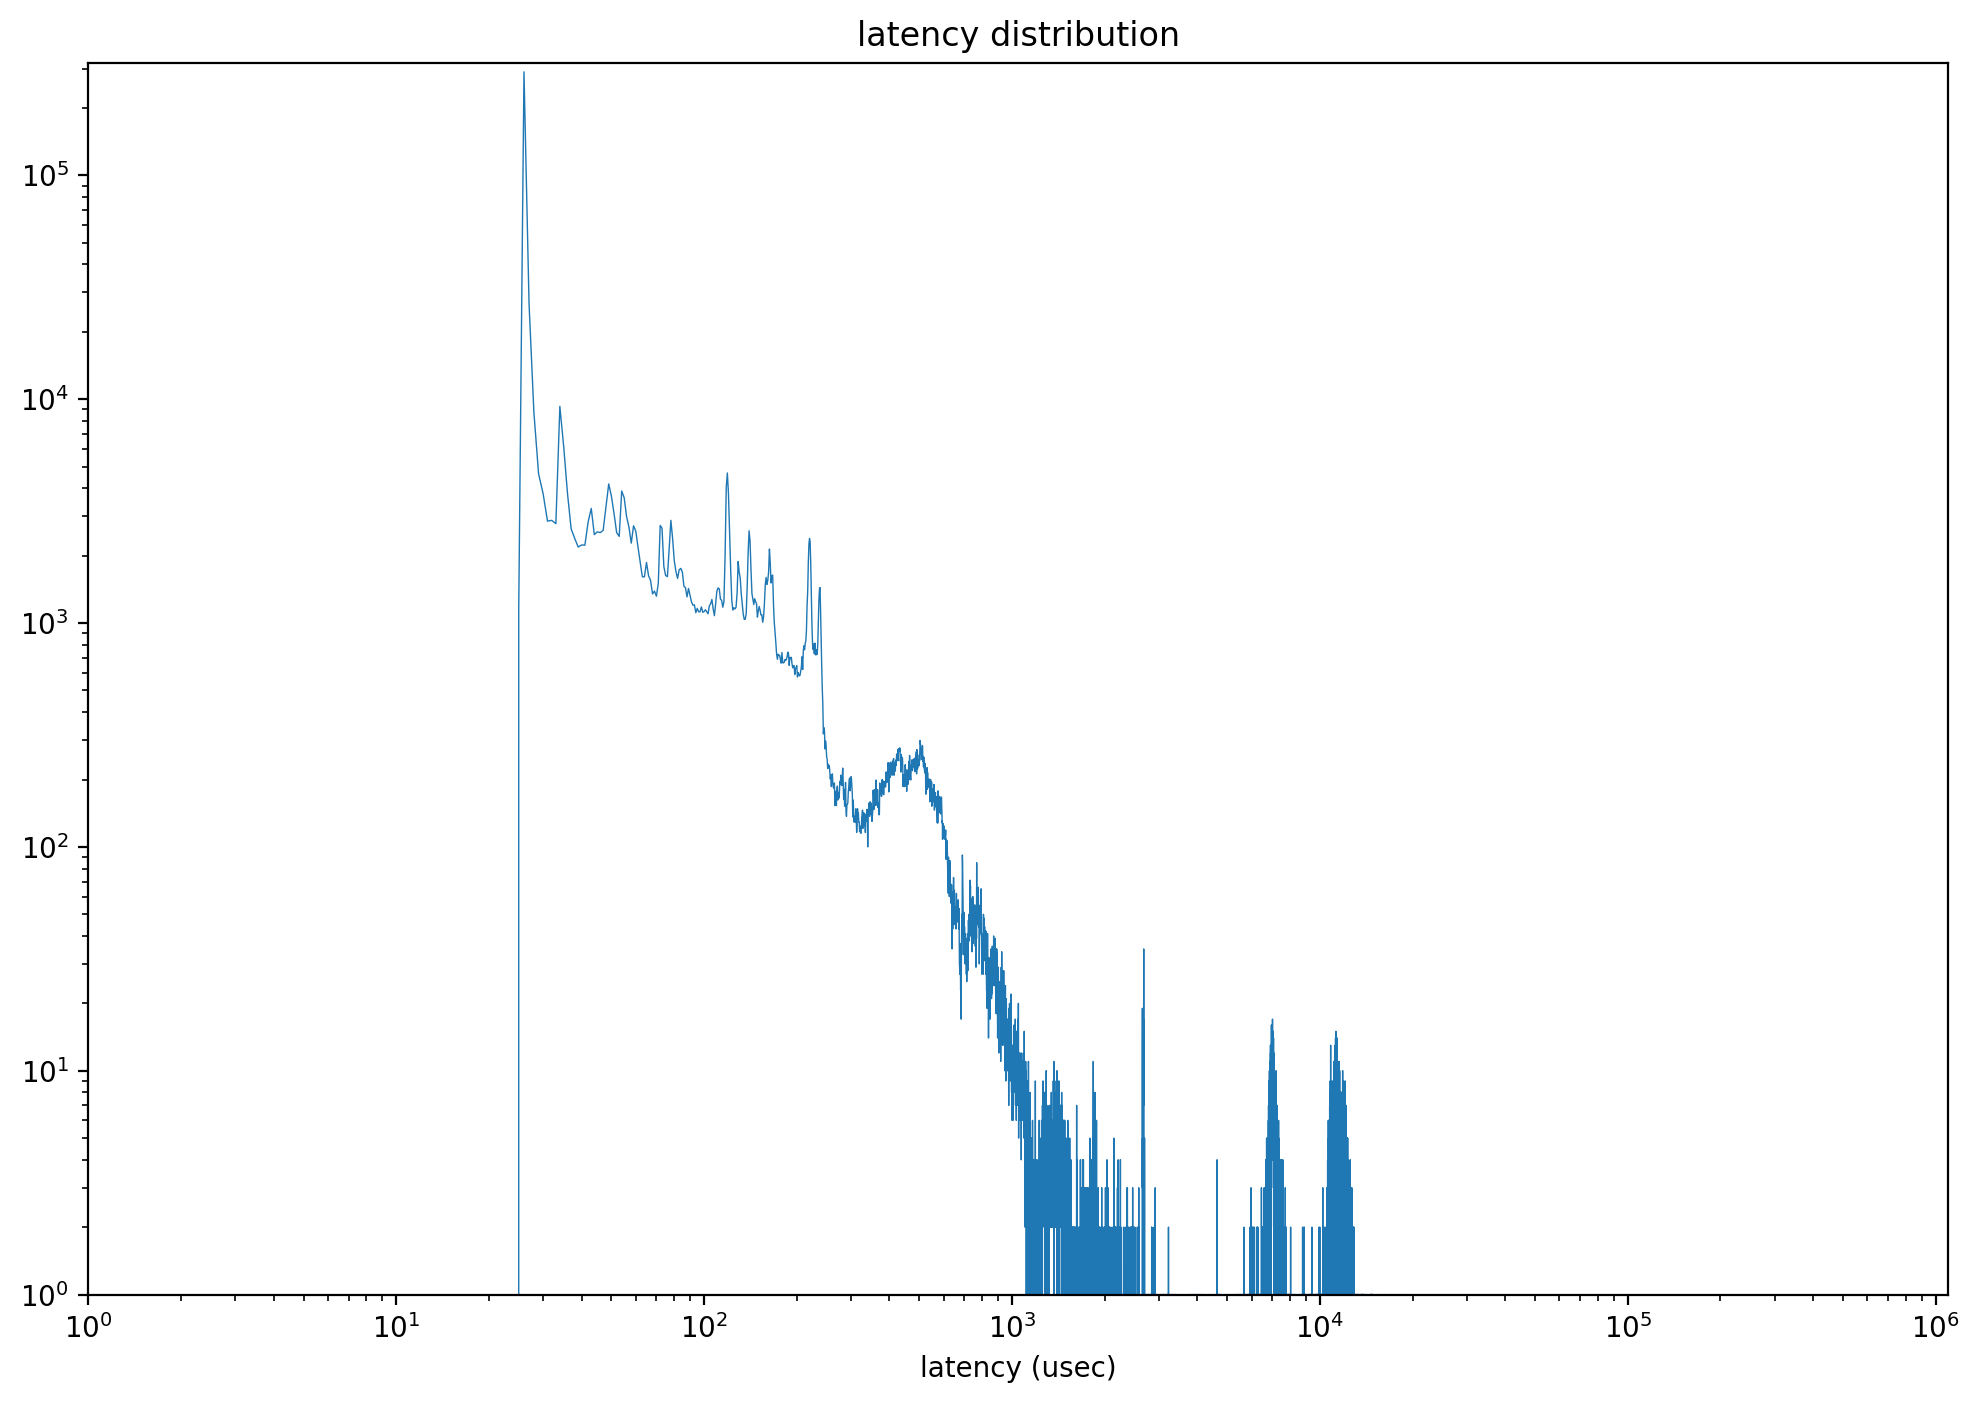 |
 |
In 2023, some manufacturers began to introduce QLC SSDs. However, current test results indicate that QLC requires further optimization in many specific scenarios and is not yet ready to replace TLC. We will keep a close eye on the development of QLC SSDs.