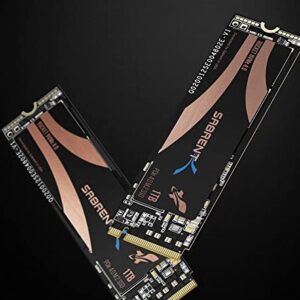
PyNVMe3 Test Report of Lexar NM710
PS4 power consumption is excellent. But the TMT1/TMT2 setting is strange.
| PS4 power consumption mW | PS4 exit latency | TMT1 (℃) | TMT2 (℃) | |
|---|---|---|---|---|
| NM710 | 2.4 | 25992.0 | 99 | 114 |
| TiPlus7100 | 2.3 | 21894.8 | 99 | 114 |
| SN770 | 15.4 | 10675.6 | 80 | 82 |
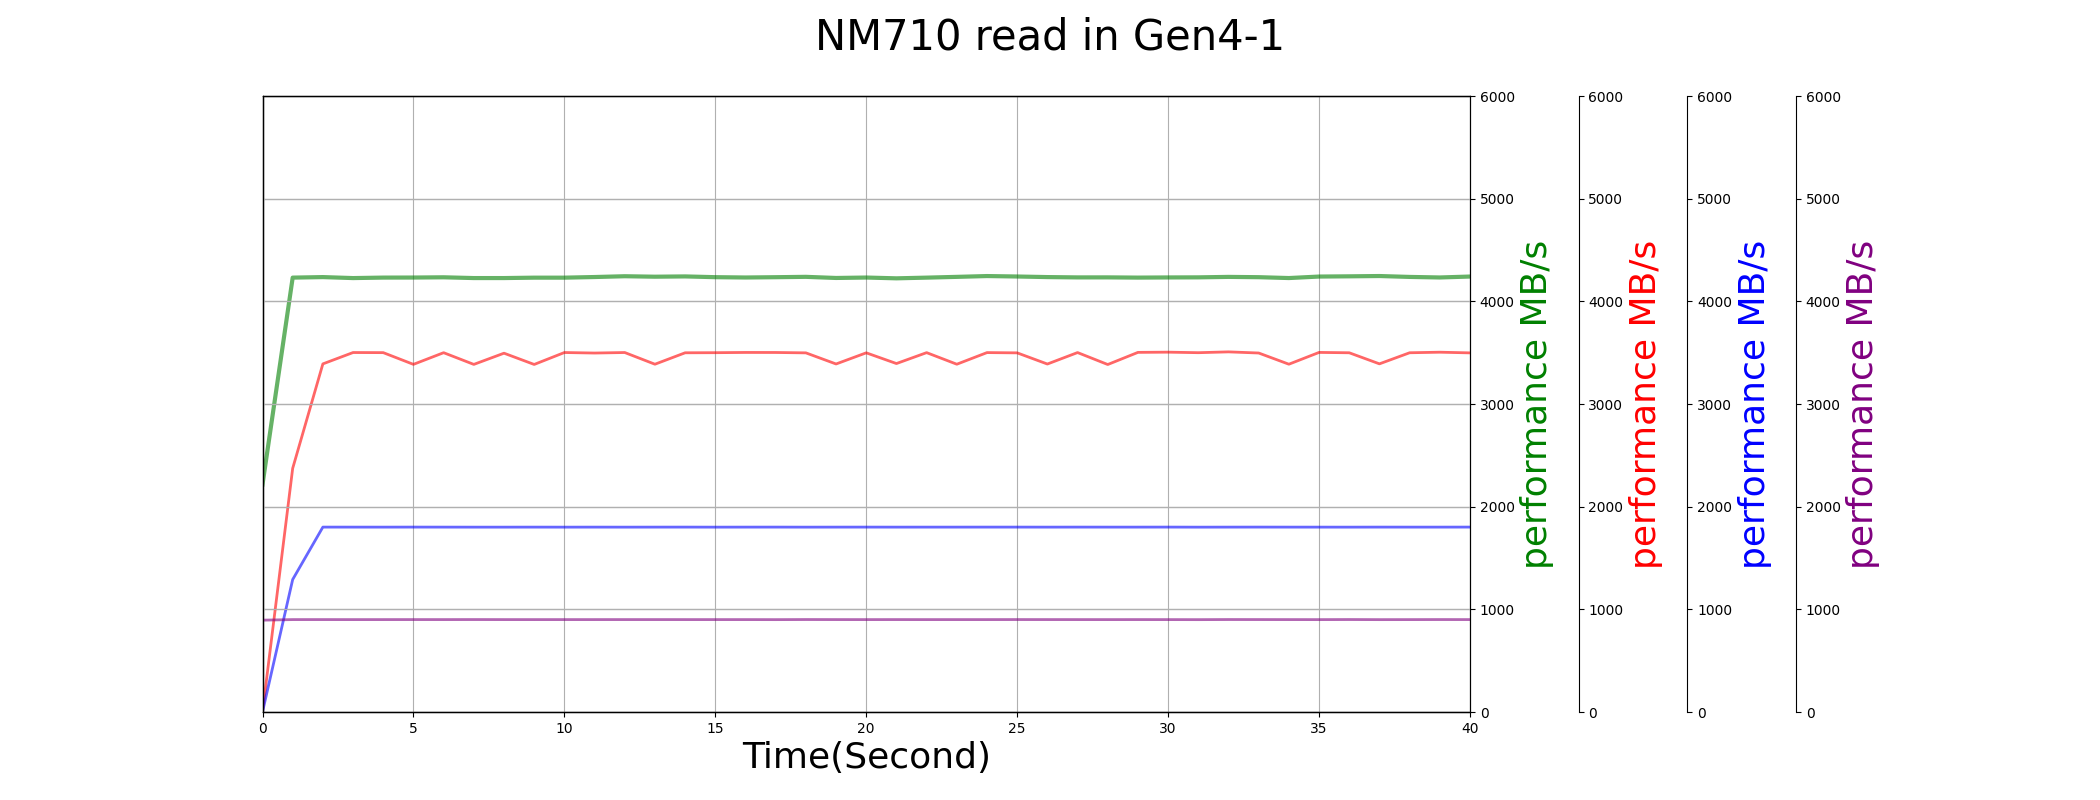
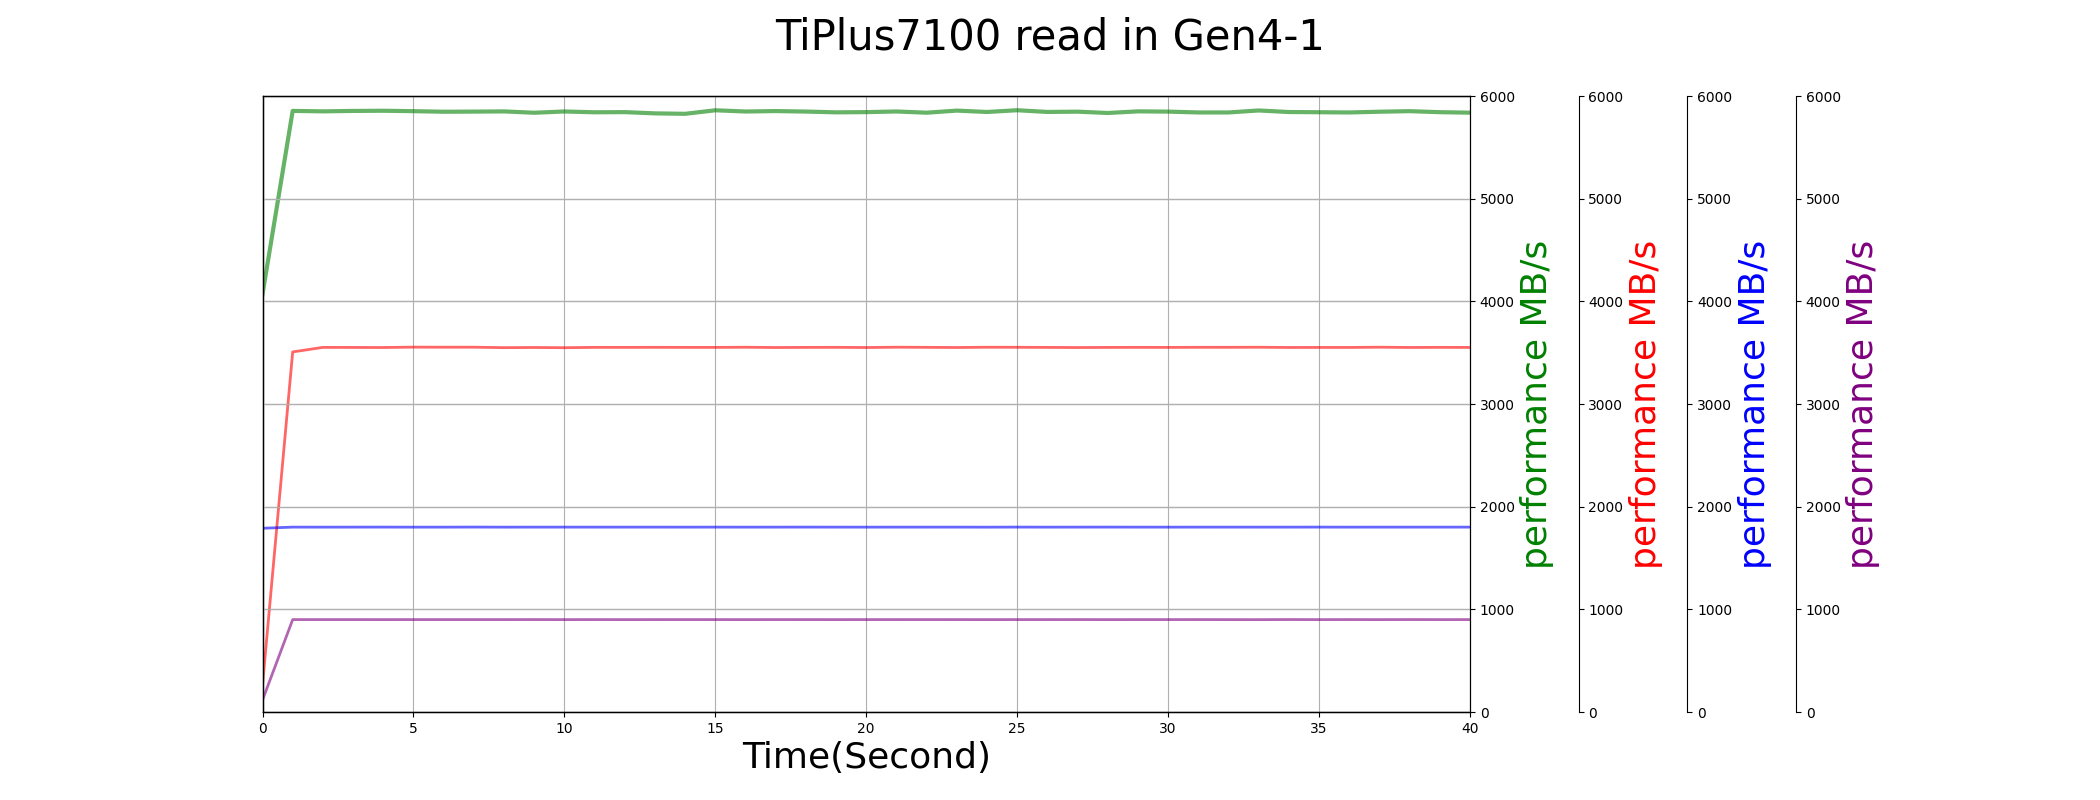
NM710 sequential read/write performance at FOB is slower than its sibling TiPlus 7100.
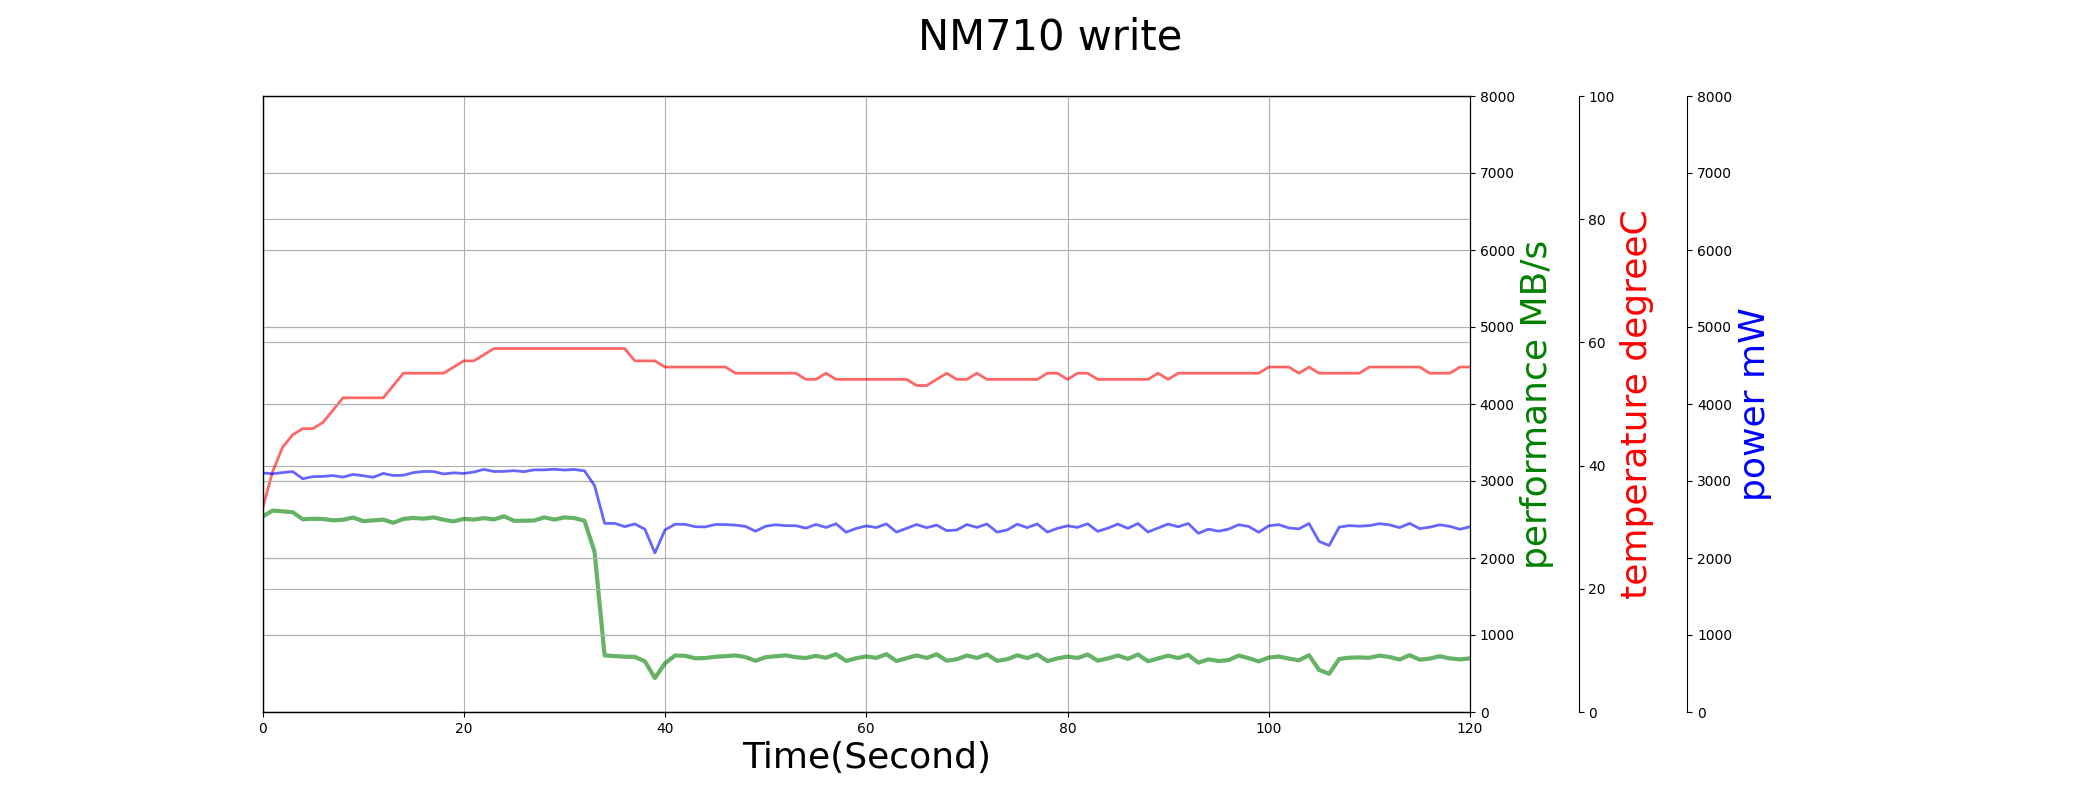
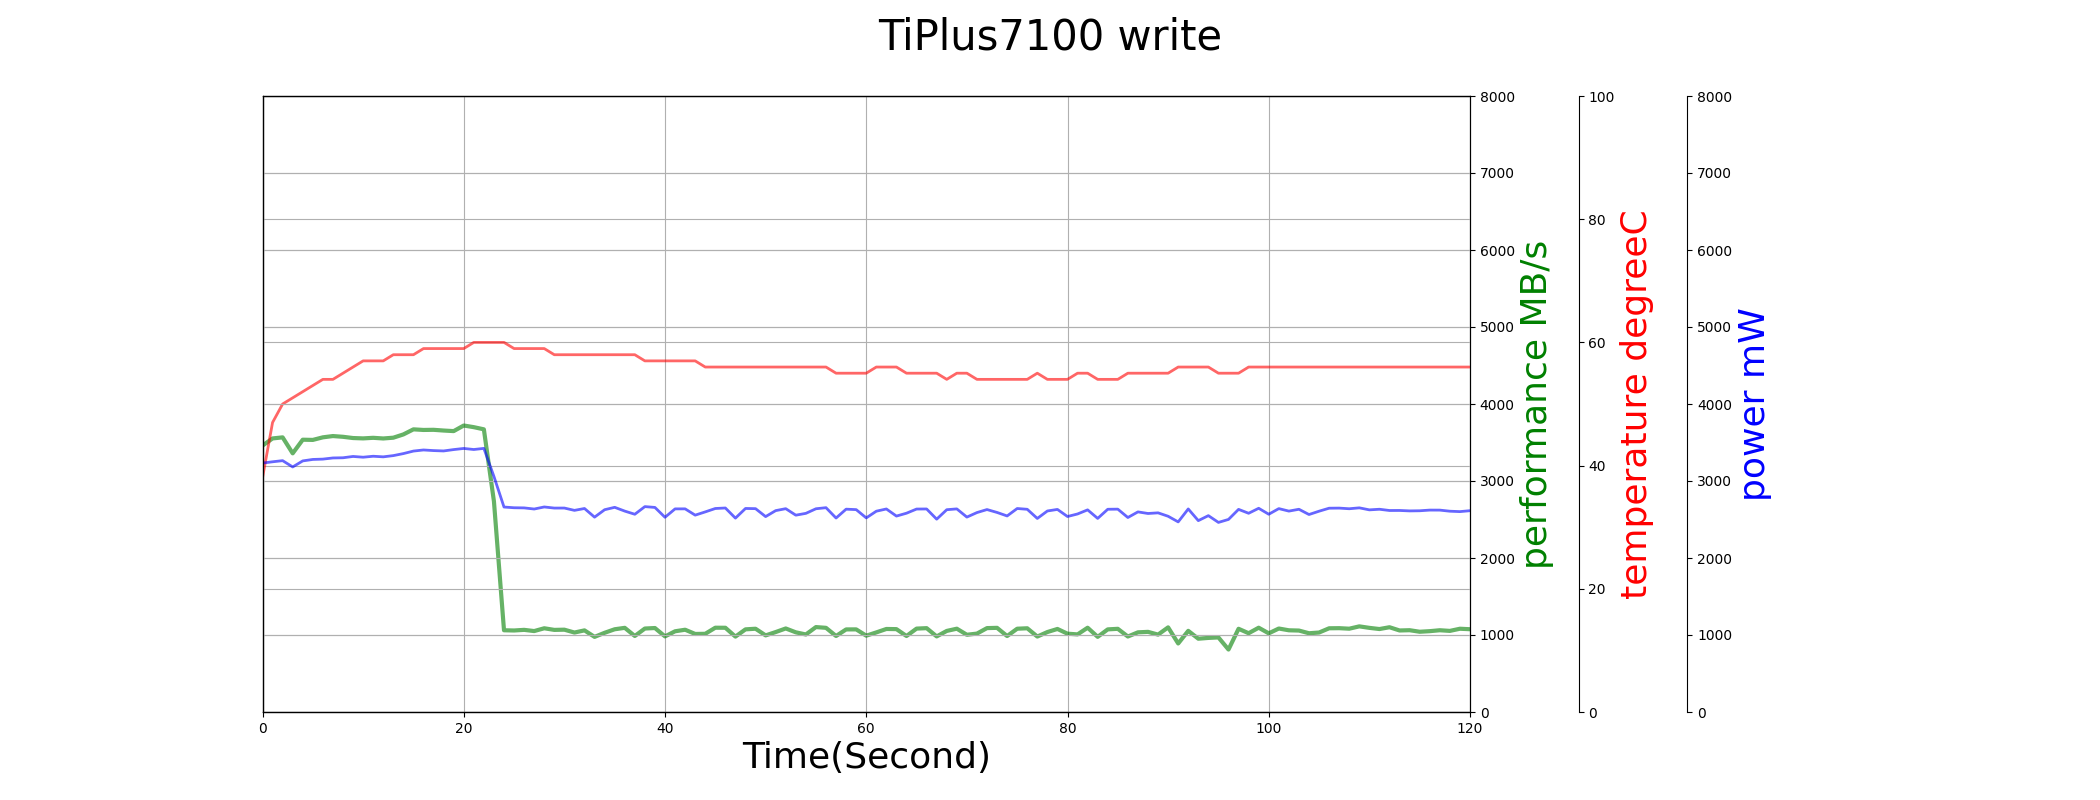
Time-0 performance issue is observed on both NM710 and TiPlus7100.
Read/write/trim mixed performance is low.
| read/write mix K IOPS | all IO mix K IOPS | JEDEC replay time Second | |
|---|---|---|---|
| NM710 | 57.013 | 1.549 | 8688.787 |
| TiPlus7100 | 53.249 | 1.605 | 7182.255 |
| SN770 | 90.504 | 8.467 | 2506.602 |
The latency of low-loading workload is high.
| 10 IOPS read 99% Latency (ms) | 100 IOPS read 99% Latency (ms) | rwmix 99% Latency (ms) | 1QD 512 write max Latency (ms) | 1QD 512 red max Latency (ms) | |
|---|---|---|---|---|---|
| NM710 | 999.999 | 3.505 | 12.928 | 114.450 | 6.167 |
| TiPlus7100 | 895.650 | 2.145 | 11.161 | 100.041 | 6.405 |
| SN770 | 102.830 | 0.154 | 11.400 | 8.751 | 5.568 |
Trim performance is not good. But write performance is recoved after trim.
| IOPS (K) | Average Latency (ms) | performance before trim (MB/s) | performance after trim (MB/s) | |
|---|---|---|---|---|
| NM710 | 0.892 | 17.912 | 965.784 | 1666.771 |
| TiPlus7100 | 0.982 | 16.282 | 1181.302 | 1861.139 |
| SN770 | 4.494 | 3.554 | 899.344 | 1818.023 |
From PE600, both read/write performance drop.
| sequential read MB/s | sequential write MB/s | random read K IOPS | random write K IOPS | |
|---|---|---|---|---|
| NM710 | 4202.428 | 2319.354 | 123.869 | 17.695 |
| PE300 | 4204.951 | 2336.024 | 125.476 | 17.822 |
| PE600 | 3955.587 | 720.599 | 79.742 | 5.498 |
| PE900 | 3967.320 | 716.710 | 79.524 | 5.468 |
| PE1200 | 3987.153 | 719.087 | 79.510 | 5.486 |