PyNVMe3 Test Report of WD SN770
| PS4 power consumption (mW) | PS4 exit latency | TMT1 (℃) | TMT2 (℃) | |
|---|---|---|---|---|
| SN770 | 15.4 | 10675.6 | 80 | 82 |
| TiPlus7100 | 2.3 | 21894.8 | 99 | 114 |
| AM6A1 | 1.9 | 20541.5 | 75 | 80 |
| S50Pro | 3.6 | 14713.4 | 80 | 84 |
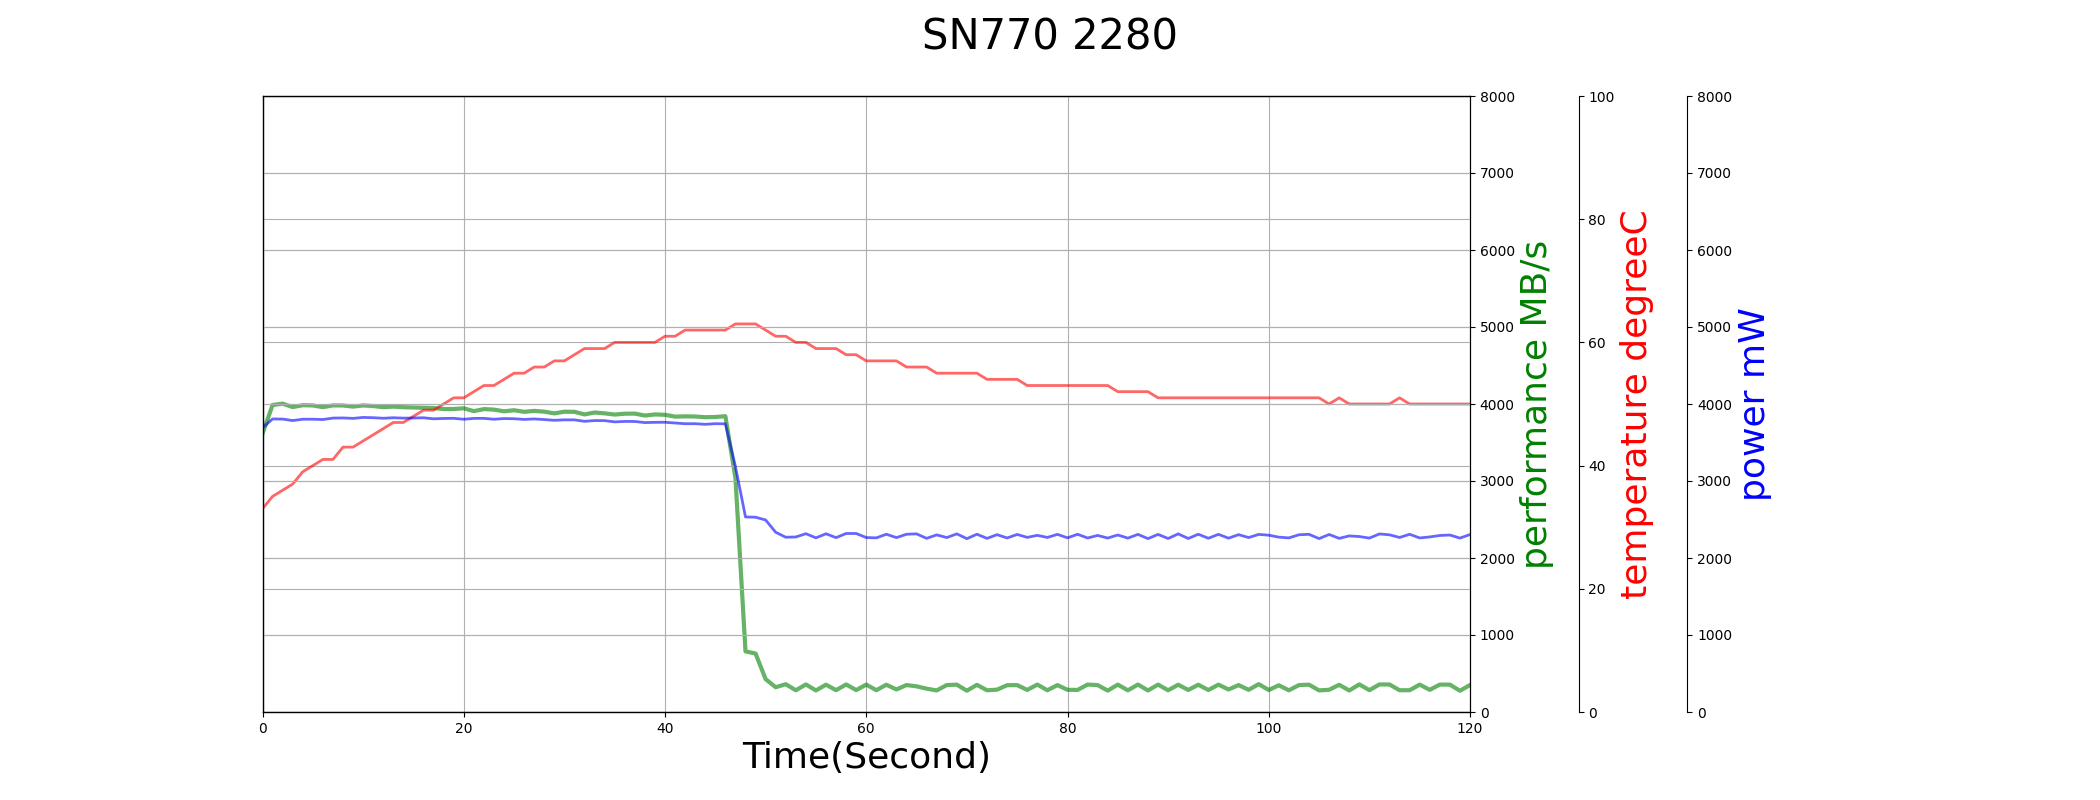
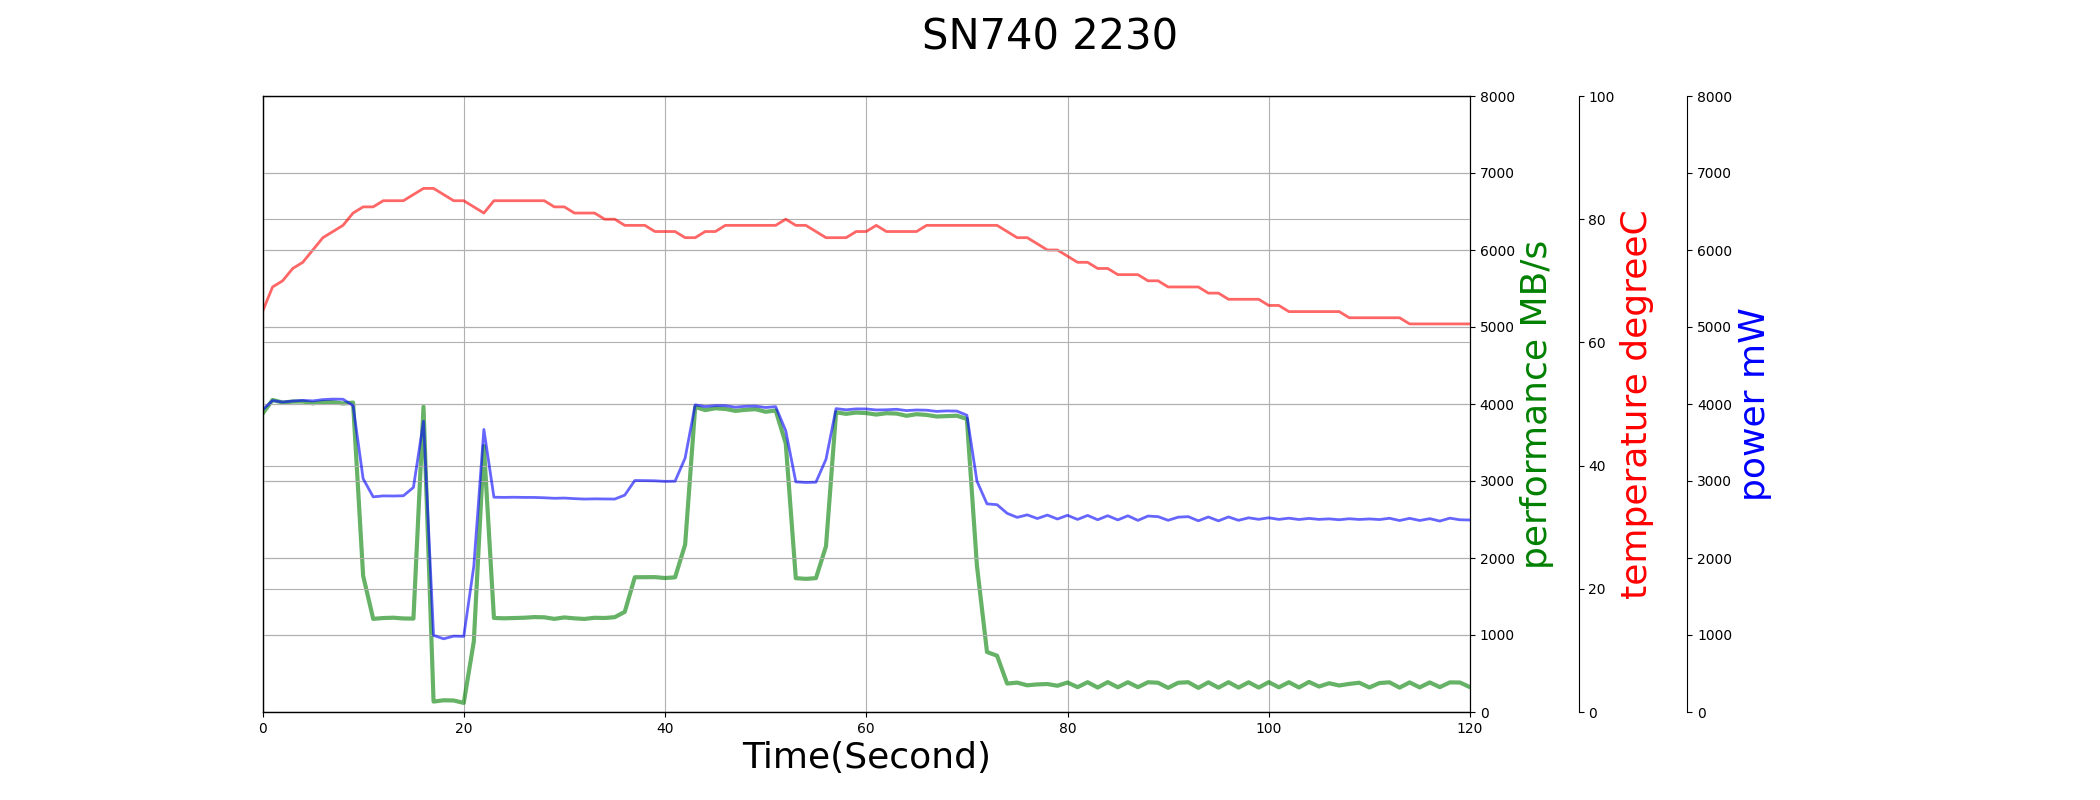
We compared SN770 (in 2280 form factor) with its sibling SN740 (in 2230 form factor). It shows SSDs with a 2280 form factor offer improved heat dissipation, leading to better performance during extended use periods.
SN770 has good performance comparing to its competitors.
| sequential read MB/s | sequential write MB/s | random read K IOPS | random write K IOPS | |
|---|---|---|---|---|
| SN770 | 5062.608 | 3194.970 | 110.502 | 24.376 |
| TiPlus7100 | 5812.128 | 2671.073 | 80.877 | 20.379 |
| AM6A1 | 4883.498 | 2491.624 | 87.604 | 19.010 |
| S50Pro | 5065.566 | 1841.256 | 149.866 | 14.048 |
In complex workload, it also has better overall performance than others.
| read/write mix random K IOPS | mixed IO K IOPS | JEDEC workload replay Second | |
|---|---|---|---|
| SN770 | 90.504 | 8.467 | 2506.602 |
| TiPlus7100 | 53.249 | 1.605 | 7182.255 |
| AM6A1 | 46.600 | 0.858 | 10957.918 |
| S50Pro | 39.410 | 1.942 | 4750.455 |
The latency on low-loading workload is controlled well.
| 10 IOPS Latency (ms) | 100 IOPS Latency (ms) | rwmix 99% Latency (ms) | 1QD512 write maxLatency (ms) | 1QD512 read maxLatency (ms) | |
|---|---|---|---|---|---|
| SN770 | 102.830 | 0.154 | 11.400 | 8.751 | 5.568 |
| TiPlus7100 | 895.650 | 2.145 | 11.161 | 100.041 | 6.405 |
| AM6A1 | 552.269 | 0.162 | 553.129 | 372.284 | 2.838 |
| S50Pro | 1.824 | 0.166 | 250.884 | 123.254 | 8.940 |
When the drive is 90% filled, the sequential write performance droped a lot.
| 10% filled write performance MB/s | 50% filled write performance MB/s | 90% filled write performance MB/s | 150% filled write performance MB/s | after trim write performance MB/s | |
|---|---|---|---|---|---|
| SN770 | 3953.405 | 780.706 | 208.933 | 722.806 | 3793.133 |
| TiPlus7100 | 3638.746 | 604.864 | 471.318 | 740.793 | 3489.249 |
| AM6A1 | 2646.220 | 378.511 | 179.113 | 174.409 | 2612.796 |
| S50Pro | 3960.046 | 187.652 | 220.446 | 163.951 | 529.919 |
Sequential read performance is good.
| 10% sequential read MB/s | 50% sequential read MB/s | 90% sequential read MB/s | 150% sequential read MB/s | |
|---|---|---|---|---|
| SN770 | 5062.608 | 4584.272 | 4394.824 | 4609.870 |
| TiPlus7100 | 5812.128 | 5154.022 | 3446.654 | 4511.179 |
| AM6A1 | 4883.498 | 4805.897 | 3958.973 | 4636.117 |
| S50Pro | 5065.566 | 4449.121 | 4194.586 | 4786.295 |
Random write performance is good.
| 10% random write K IOPS | 50% random write K IOPS | 90% random write K IOPS | 150% random write K IOPS | after-trim random write K IOPS | |
|---|---|---|---|---|---|
| SN770 | 84.480 | 77.129 | 85.310 | 77.100 | 84.104 |
| TiPlus7100 | 62.881 | 62.351 | 49.071 | 47.237 | 39.423 |
| AM6A1 | 46.205 | 24.012 | 19.733 | 37.727 | 45.313 |
| S50Pro | 25.332 | 23.739 | 29.586 | 22.998 | 30.984 |
Random read performance is good.
| 10% random read K IOPS | 50% random read K IOPS | 90% random read K IOPS | 150% random read K IOPS | |
|---|---|---|---|---|
| SN770 | 110.502 | 103.483 | 100.875 | 101.367 |
| TiPlus7100 | 80.877 | 67.528 | 66.457 | 68.175 |
| AM6A1 | 87.604 | 92.908 | 84.440 | 88.528 |
| S50Pro | 149.866 | 140.465 | 136.020 | 140.534 |
Trim works well on performance and latency.
| IOPS (K) | Average Latency (ms) | performance before trim (MB/s) | performance after trim (MB/s) | |
|---|---|---|---|---|
| SN770 | 4.494 | 3.554 | 899.344 | 1818.023 |
| TiPlus7100 | 0.982 | 16.282 | 1181.302 | 1861.139 |
| AM6A1 | 0.325 | 49.180 | 292.450 | 1637.893 |
| S50Pro | 2.039 | 7.842 | 193.388 | 162.009 |
| SN740 | N/A | N/A | N/A | N/A |
However, the write performance drops significantly after 900 PE cycle consumed. Most probably, its SLC cache are all retired at that time.
| sequential read MB/s | sequential write MB/s | random read K IOPS | random write K IOPS | |
|---|---|---|---|---|
| SN770 | 5062.608 | 3194.970 | 110.502 | 24.376 |
| PE300 | 5061.234 | 3182.358 | 107.626 | 24.279 |
| PE600 | 5058.427 | 3183.975 | 94.376 | 24.292 |
| PE900 | 4801.729 | 826.239 | 105.751 | 6.304 |
| PE1200 | 4800.182 | 827.112 | 107.767 | 6.310 |
ioworker stress test failed due to drive timeout.