PyNVMe3 test report of Hynix P41
Power
| PS4 power mW | PS4 exit time | TMT1 (℃) | TMT2 (℃) | |
|---|---|---|---|---|
| P41 | 257.6 | 7743.1 | 82 | 85 |
| Rocket4Plus | 75.4 | 10197.0 | 75 | 78 |
| GigaByte7000s | 2.8 | 50101.4 | 81 | 84 |
| 990Pro | 4.9 | 2053.6 | 81 | 82 |
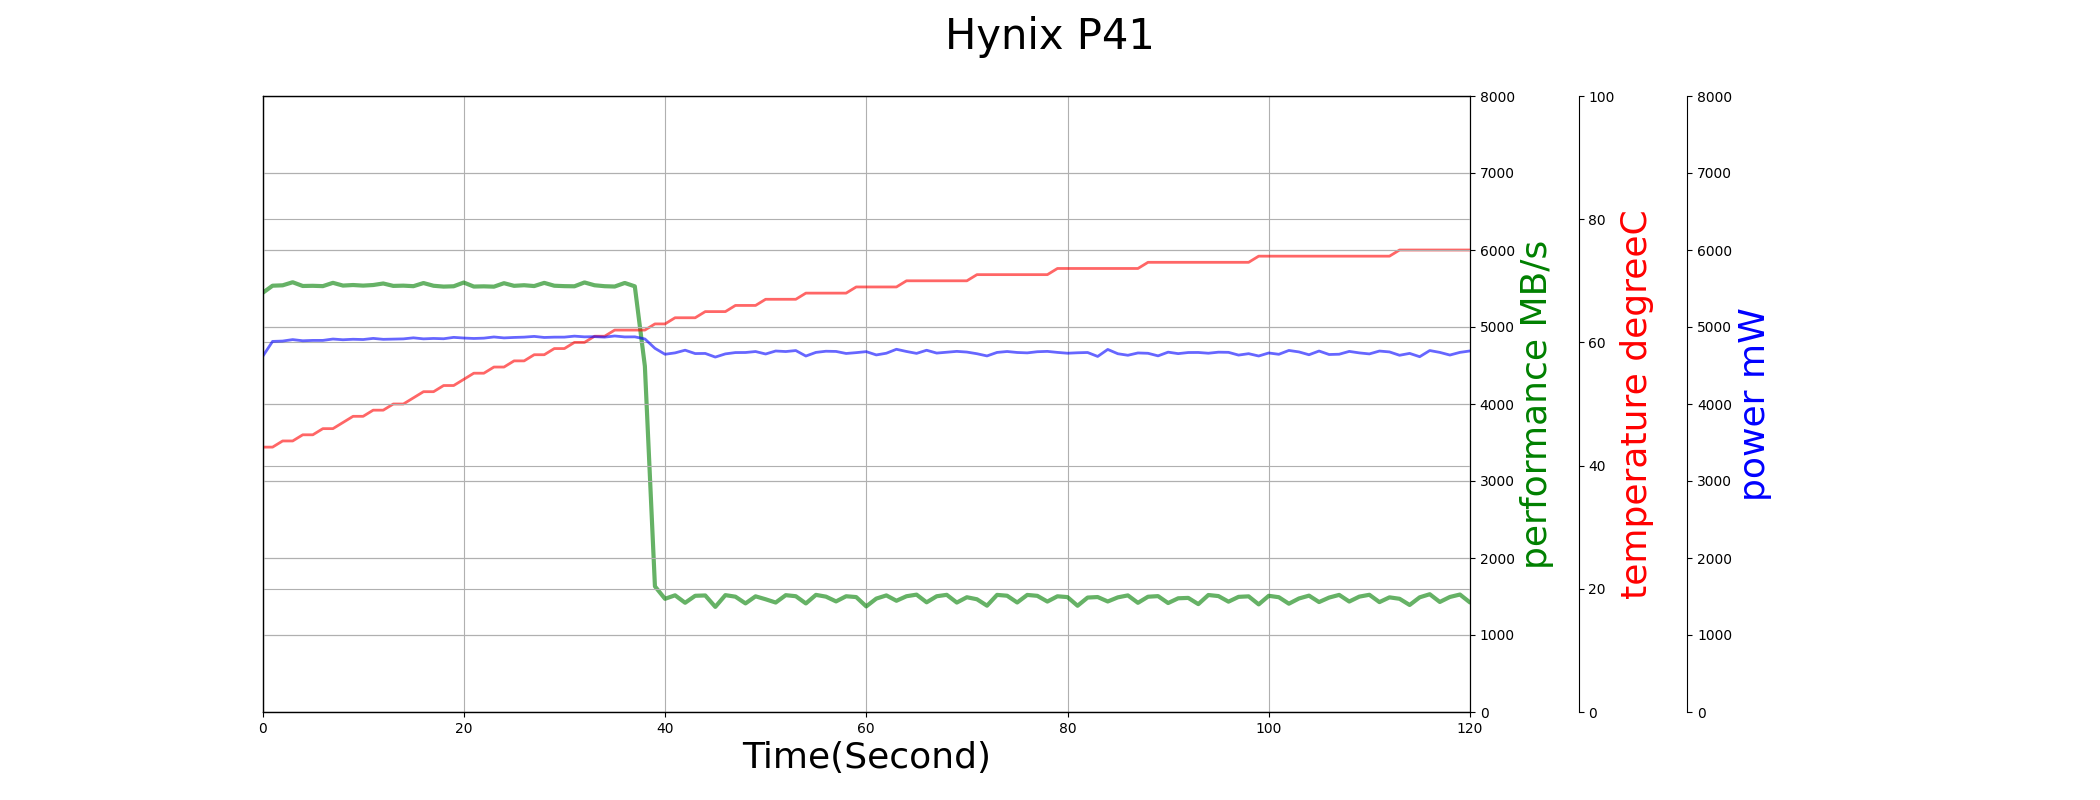
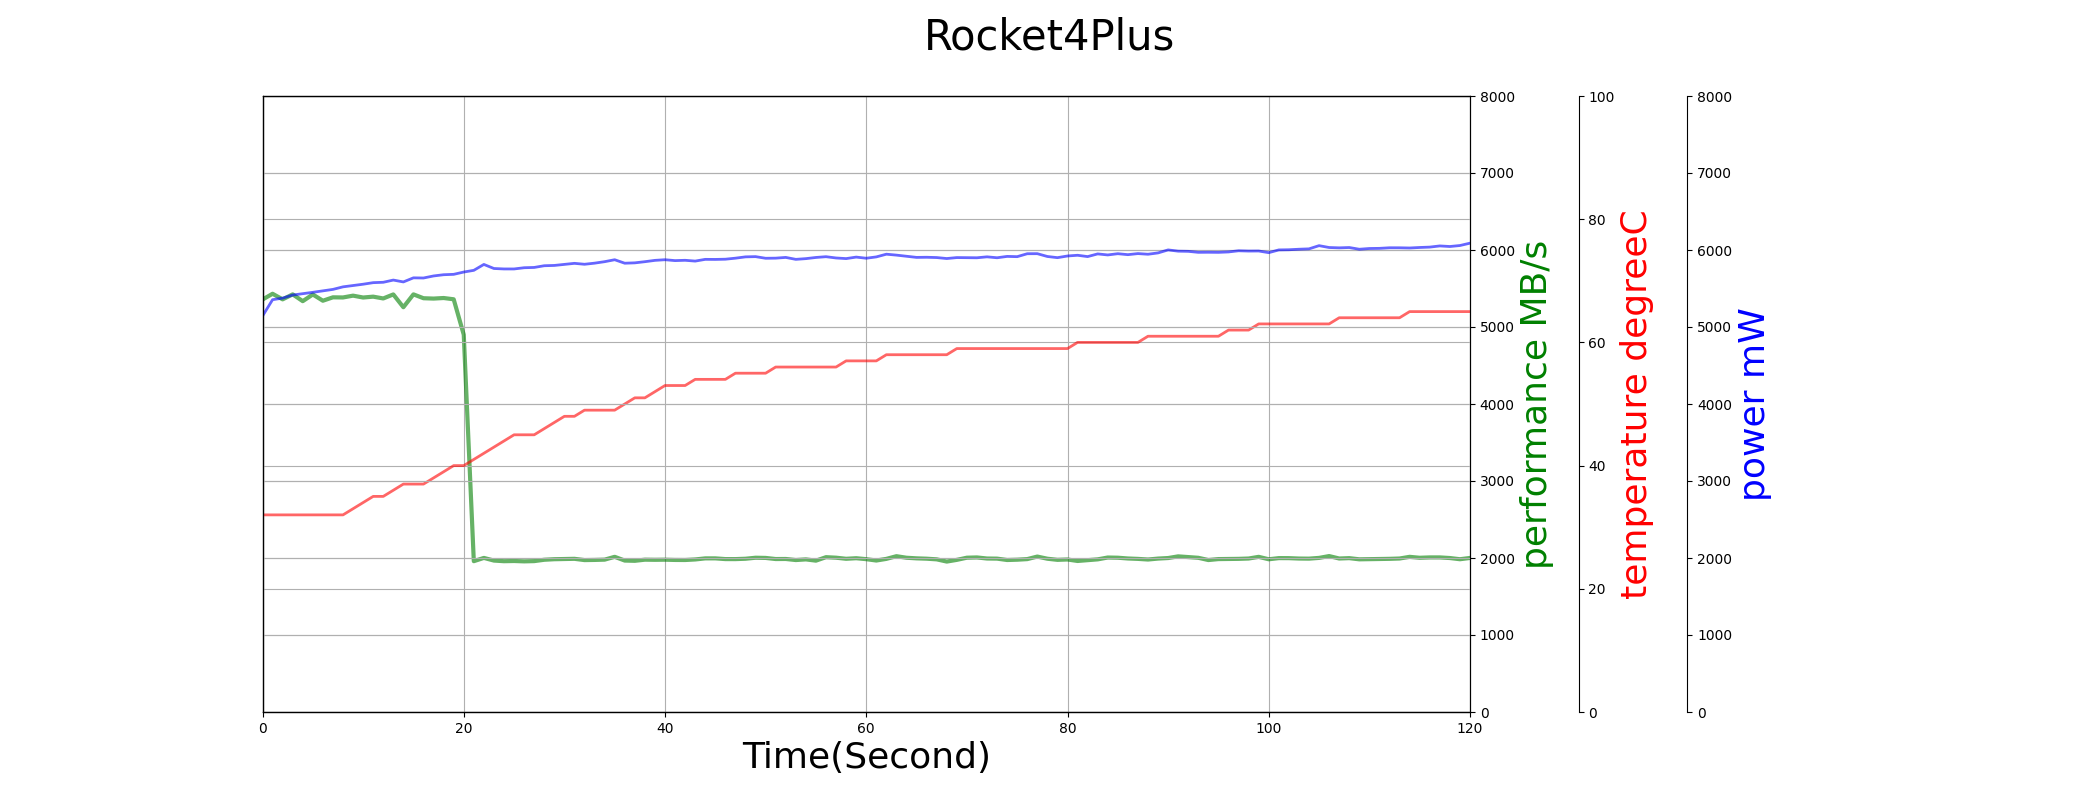
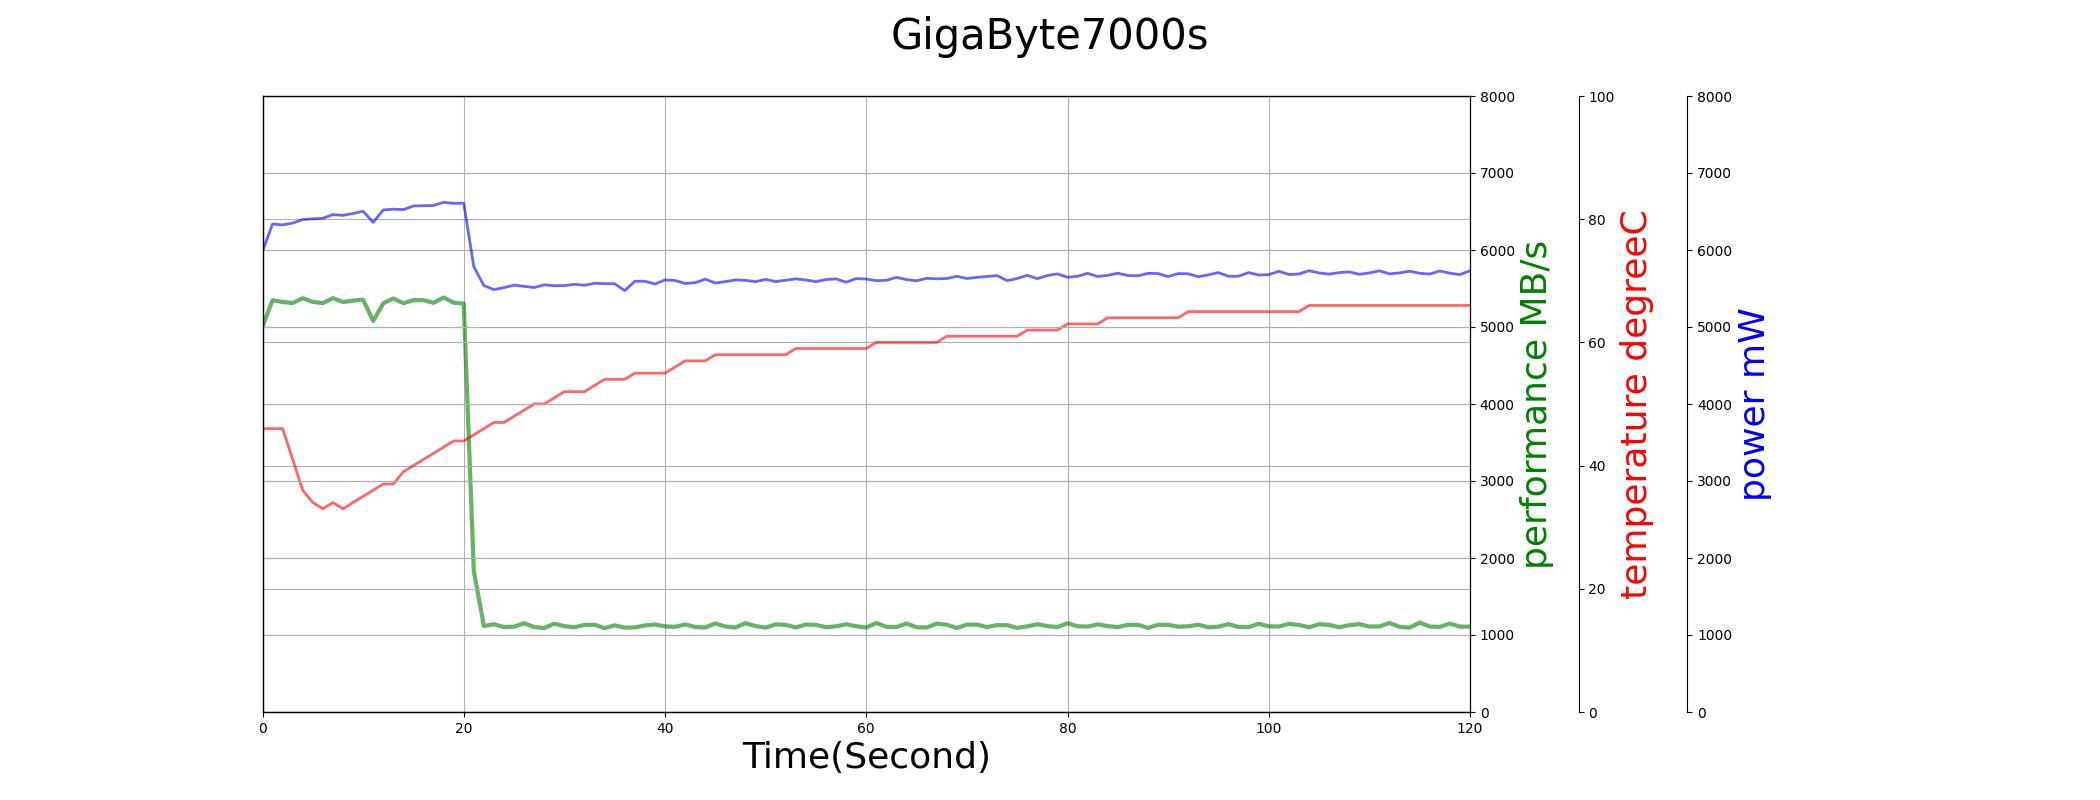
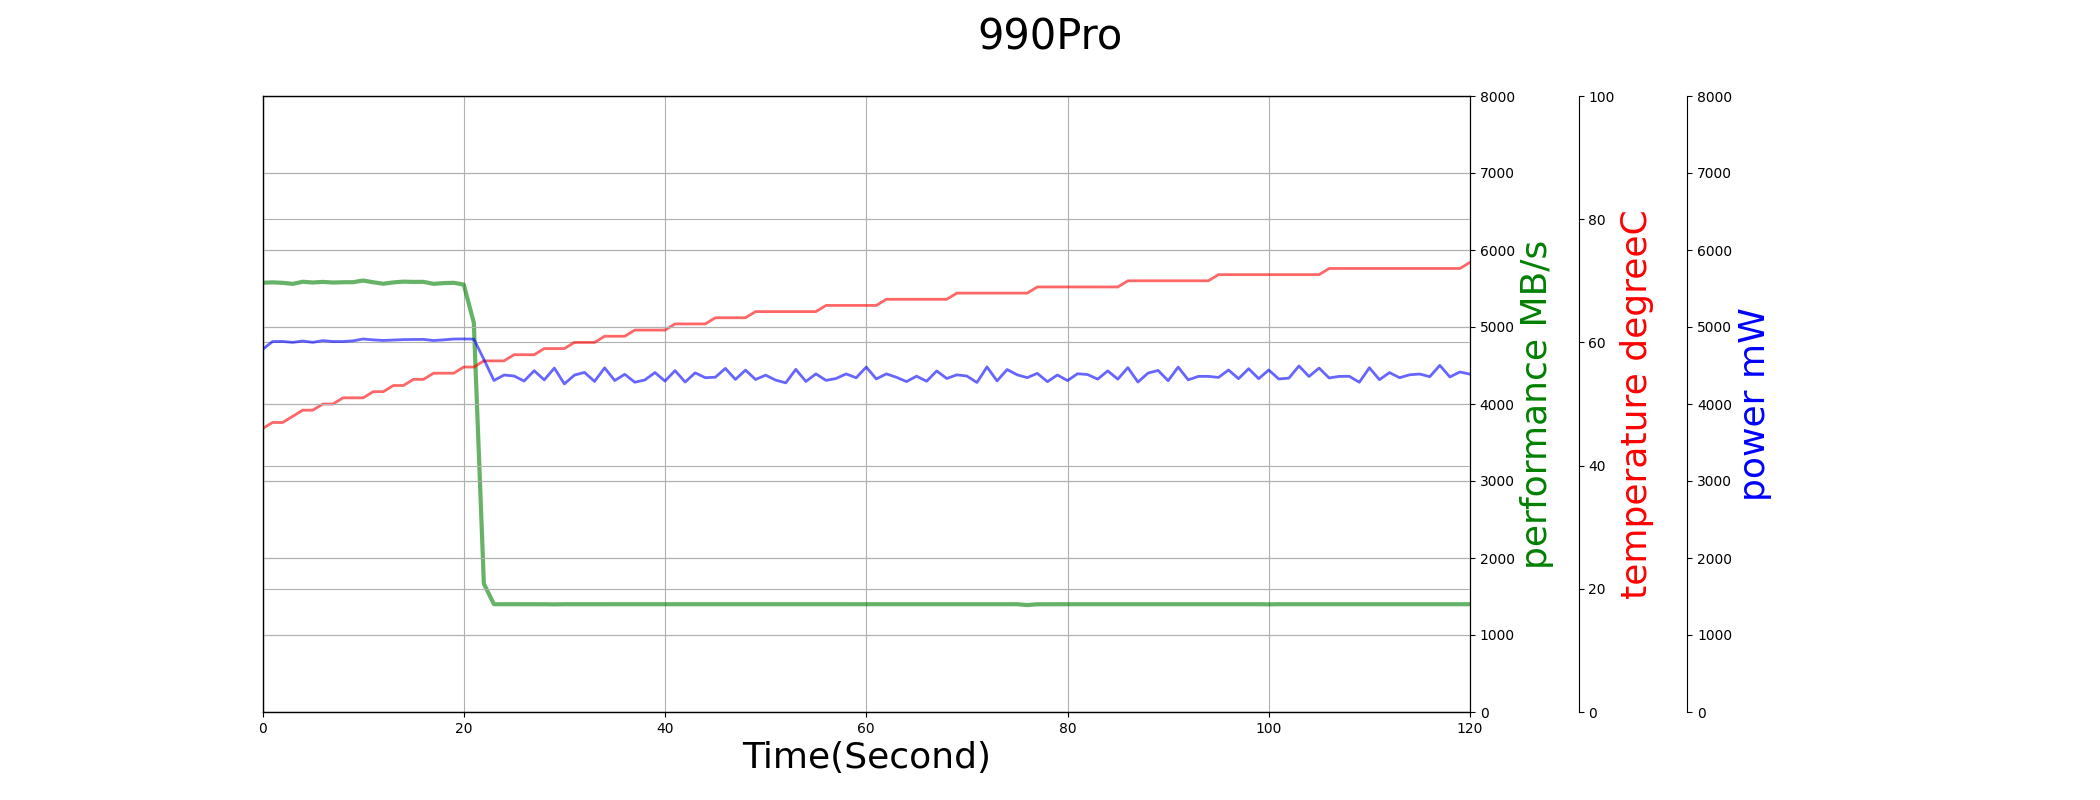
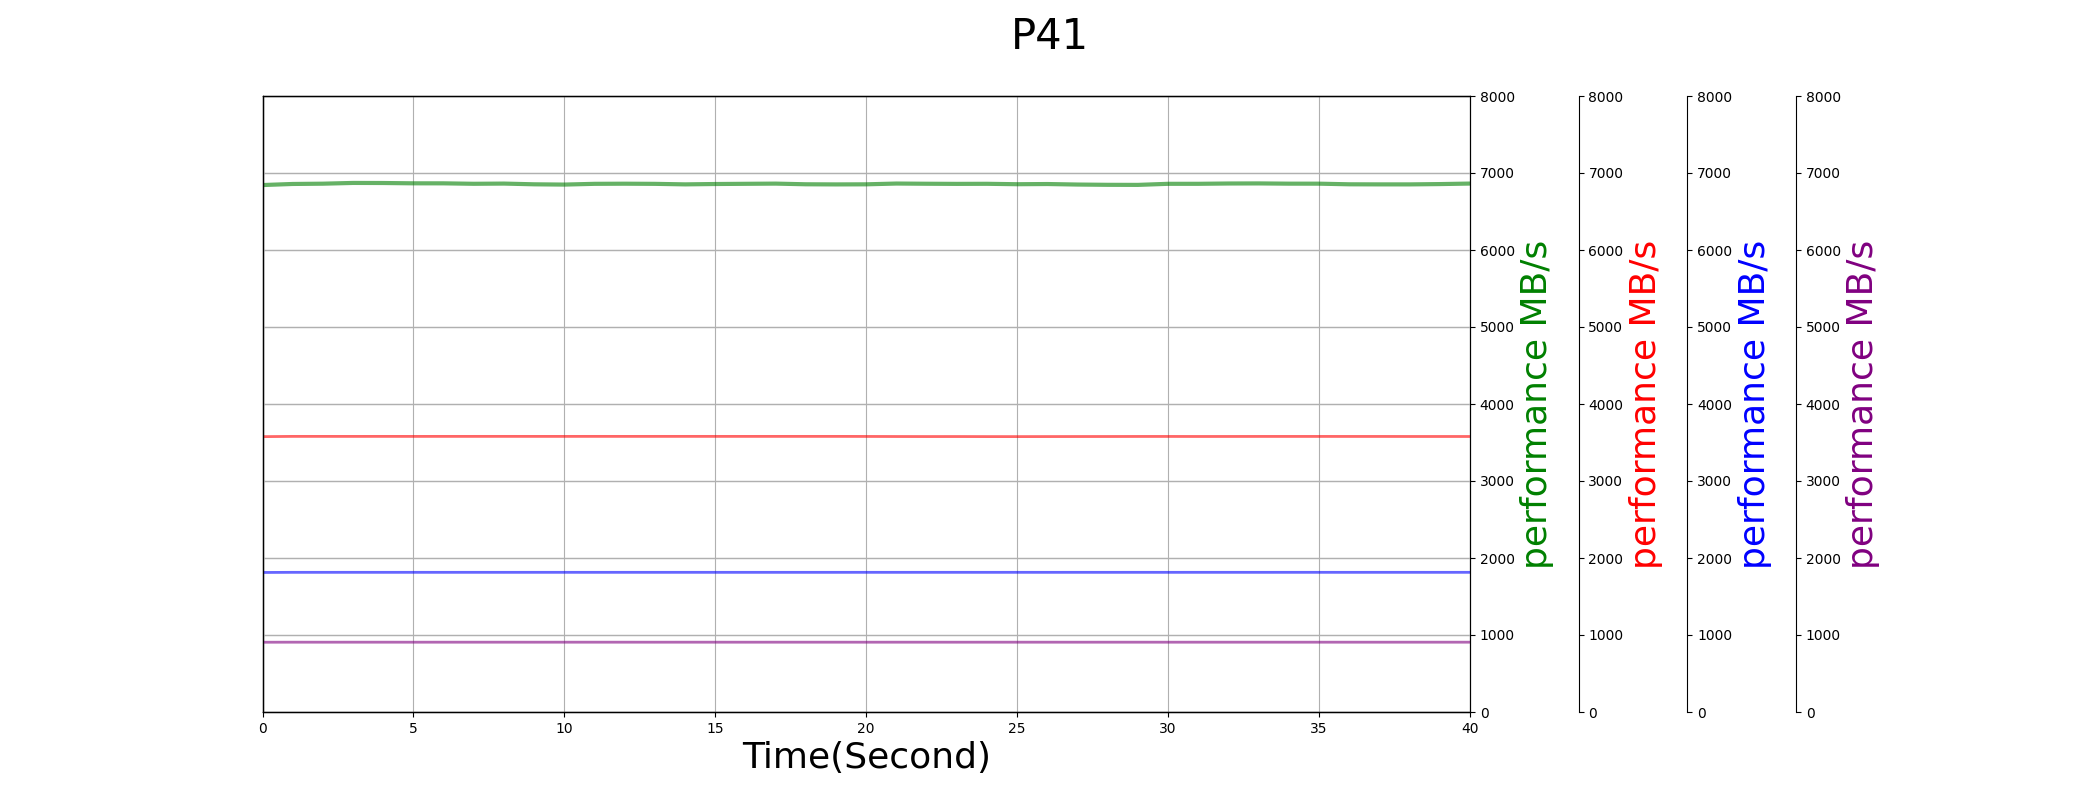
Sequential Write in FOB
From diagrams below, we can find P41 has much larger SLC cache. It may be the reaon P41 enters PS4 later and get a much higher PS4 power in the earlier test results.
990Pro’s temperature is still very high.
Gen4-Gen1 seq read performance
Gen4 read write performance
P41 and 990Pro have excellent performance, but others are also good enough.
| Seq Read MB/s | Seq Write MB/s | Random Read K IOPS | Random Write K IOPS | |
|---|---|---|---|---|
| P41 | 6859.491 | 4008.837 | 1010.465 | 30.585 |
| Rocket4Plus | 7064.128 | 4230.312 | 568.834 | 32.275 |
| GigaByte7000s | 6217.582 | 3915.676 | 314.446 | 29.874 |
| 990Pro | 7109.983 | 2920.614 | 857.872 | 22.283 |
Mixed performance
In a read/write/trim mixed workload, the P41 delivers the highest performance. The 990Pro performs significantly better than its predecessor, the 980Pro.
| RW Mixed K IOPS | RW/Trim Mixed K IOPS | JEDEC test duration S | |
|---|---|---|---|
| P41 | 218.772 | 11.671 | 2971.417 |
| Rocket4Plus | 278.446 | 3.745 | 5458.270 |
| GigaByte7000s | 167.809 | 4.267 | 4395.852 |
| 990Pro | 510.325 | 6.936 | 4182.376 |
low-loading latency
| 10IOPS读99%Latency (ms) | 100IOPS读99%Latency (ms) | rwmix99%Latency (ms) | 1QD512写maxLatency (ms) | 1QD512读maxLatency (ms) | |
|---|---|---|---|---|---|
| P41 | 0.161 | 0.060 | 8.082 | 7.623 | 7.328 |
| Rocket4Plus | 6.847 | 0.071 | 6.097 | 10.132 | 6.889 |
| GigaByte7000s | 6.574 | 0.095 | 14.207 | 9.847 | 6.484 |
| 990Pro | 1.708 | 0.066 | 11.641 | 12.416 | 7.943 |
Full drive performance
990Pro has the best write speed when the drive is used up.
| 10%-full write MB/s | 50%-full write MB/s | 90%-full write MB/s | 150%-full write MB/s | 50%-trimed write MB/s | |
|---|---|---|---|---|---|
| P41 | 5519.930 | 1735.471 | 955.609 | 575.441 | 5387.219 |
| Rocket4Plus | 5372.183 | 1097.728 | 771.419 | 1683.628 | 5094.582 |
| GigaByte7000s | 5286.258 | 696.040 | 600.635 | 914.015 | 5027.432 |
| 990Pro | 5535.679 | 1661.820 | 1421.784 | 1411.560 | 5138.705 |
| 10%-full read MB/s | 50%-full read MB/s | 90%-full read MB/s | 150%-fll read MB/s | 50%-trimed read MB/s | |
|---|---|---|---|---|---|
| P41 | 6859.491 | 6873.012 | 5954.271 | 6865.396 | 6043.680 |
| Rocket4Plus | 7064.128 | 6140.319 | 5605.152 | 6038.922 | 4942.408 |
| GigaByte7000s | 6217.582 | 5092.381 | 4273.264 | 5455.072 | 4797.552 |
| 990Pro | 7109.983 | 6613.611 | 5775.996 | 7077.560 | 7111.539 |
Trim performance
Rocket4Plus has the worse trim performance.
| IOPS (K) | Average Latency (ms) | performance before trim (MB/s) | performance after trim (MB/s) | |
|---|---|---|---|---|
| P41 | 4.644 | 3.429 | 2141.227 | 2641.621 |
| Rocket4Plus | 1.588 | 10.063 | 1907.633 | 3394.048 |
| GigaByte7000s | 3.344 | 4.767 | 1204.683 | 3152.076 |
| 990Pro | 3.900 | 4.096 | 1468.338 | 2914.261 |