ZhiTai TiPro7000 1TB
Basic Information
In this report, we compare ZhiTai (YMTC’s channel brand) TiPro7000 with 980Pro and SN850 from Samsung and WD respectively. They are all designed for high-end Client market, like gaming PC.
| Model Name | Firmware Version | |
|---|---|---|
| TiPro7000 | ZHITAI TiPro7000 THREE-BODY 1TB | ZTA32F46 |
| 980Pro | Samsung SSD 980 PRO 1TB | 5B2QGXA7 |
| SN850 | WDS100T1X0E-00AFY0 | 614900WD |
Latency
First of all, let’s check their latency. We believe Latency is overlooked in many SSD evaluations.
Max Write Latency
| 10 IOPS (ms) | 4K 1QD (ms) | 512B 1QD 10p filled (ms) | 512B 1QD 50% filled (ms) | 4K mix RW 90% filled (ms) | RW mixed with trim (ms) | Trim 50% (ms) | Overwrite 50% (ms) | |
|---|---|---|---|---|---|---|---|---|
| TiPro7000 | 50.809 | 255.160 | 254.445 | 265.706 | 248.747 | 256.812 | 257.933 | 250.619 |
| aged1 | 161.036 | 260.417 | 278.812 | 274.341 | 286.072 | 253.195 | 264.161 | 801.613 |
| aged2 | 154.106 | 254.654 | 277.669 | 281.274 | 280.474 | 290.754 | 282.330 | 293.091 |
| 980Pro | 8.616 | 8.461 | 8.462 | 14.148 | 42.767 | 113.652 | 58.529 | 105.543 |
| SN850 | 0.287 | 5.812 | 6.555 | 6.118 | 166.909 | 15.846 | 13.649 | 1158.337 |
Appearently, TiPro7000 has the high max latency problem in most of the test cases. It would give users sluggish experience sometime.
Speed
We test write performance after filling 10% and 50% of the whole space respectively.
Sequential Write
| 10% filled (MB/s) | 50% filled (MB/s) | 90% filled (MB/s) | |
|---|---|---|---|
| TiPro7000 | 5366.736 | 2200.192 | 996.669 |
| aged2 | 1527.100 | 1524.846 | 1524.079 |
| 980Pro | 3065.800 | 1730.118 | 1796.586 |
| SN850 | 4833.883 | 1427.258 | 1649.519 |
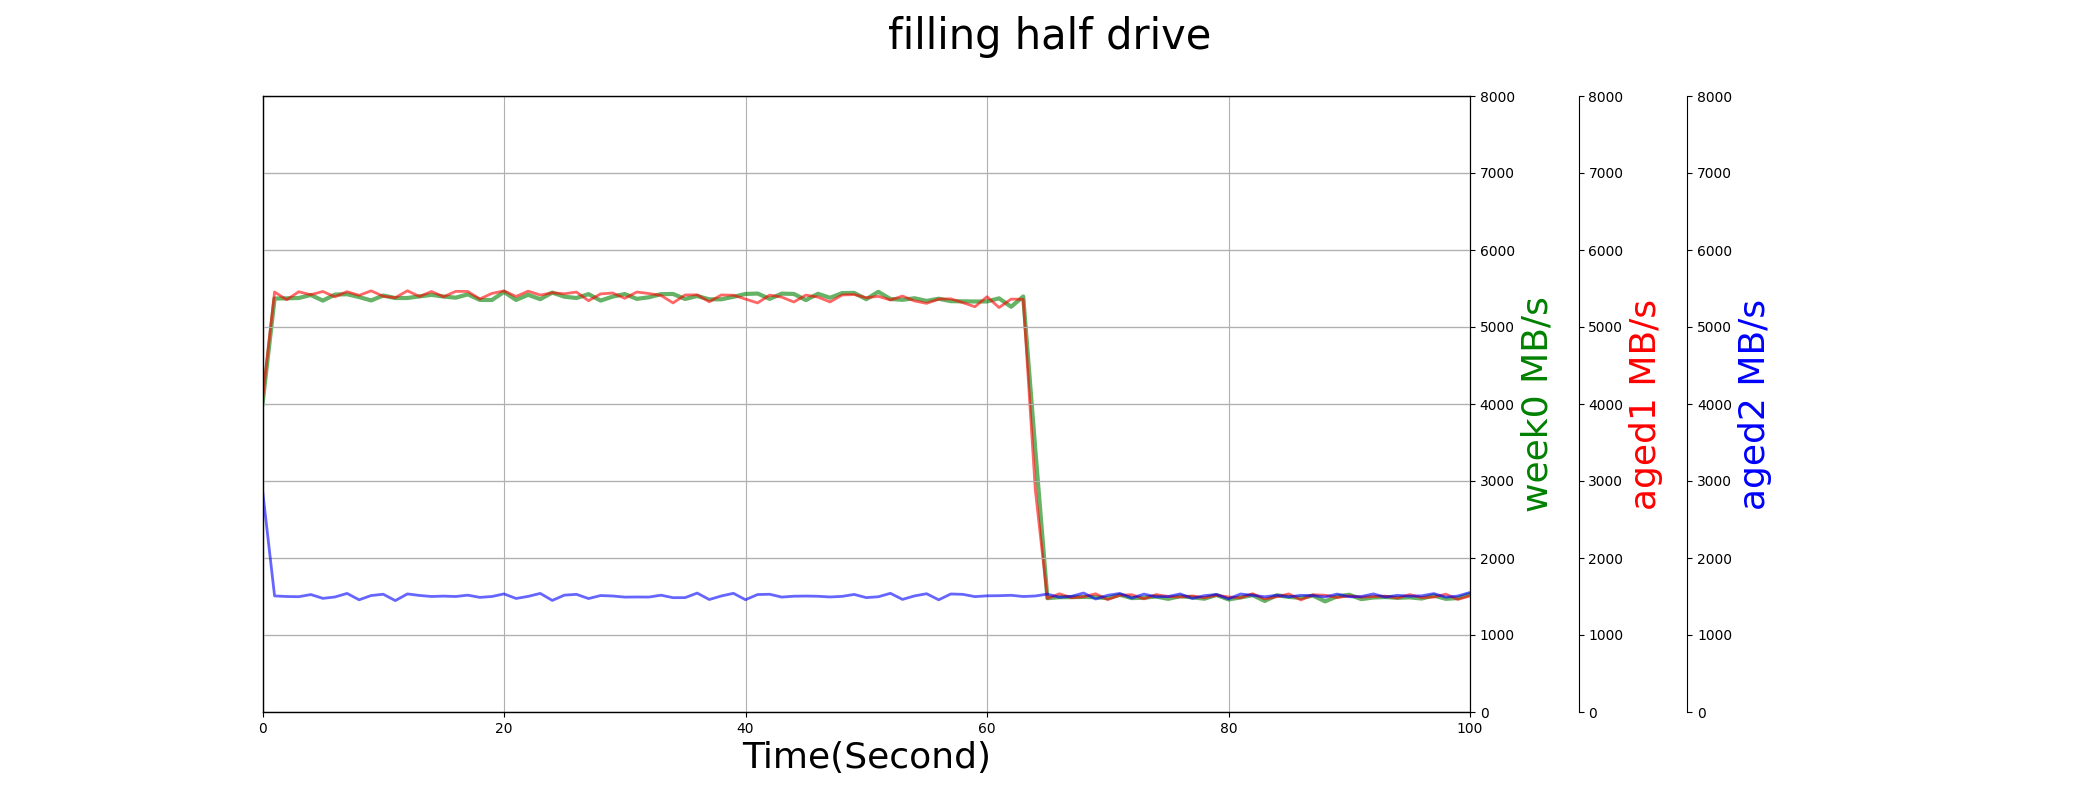
When drive is young, TiPro7000 has much higher performance than 980Pro and SN850. When it is aged (in aged2, P/E>2000), its sequential write speed drops to 1.5GB/s. This performance drop is expected, because the SLC cache may retired at that time.
When the drive is highly utilized (90% filled), TiPro7000’s sequential write speed drops significantly to less than 1GB/s.
From the diagram below, we can find the same problem of Lenovo Y9000: time 0 performance is very low. The drive seems be kicked off later than others.
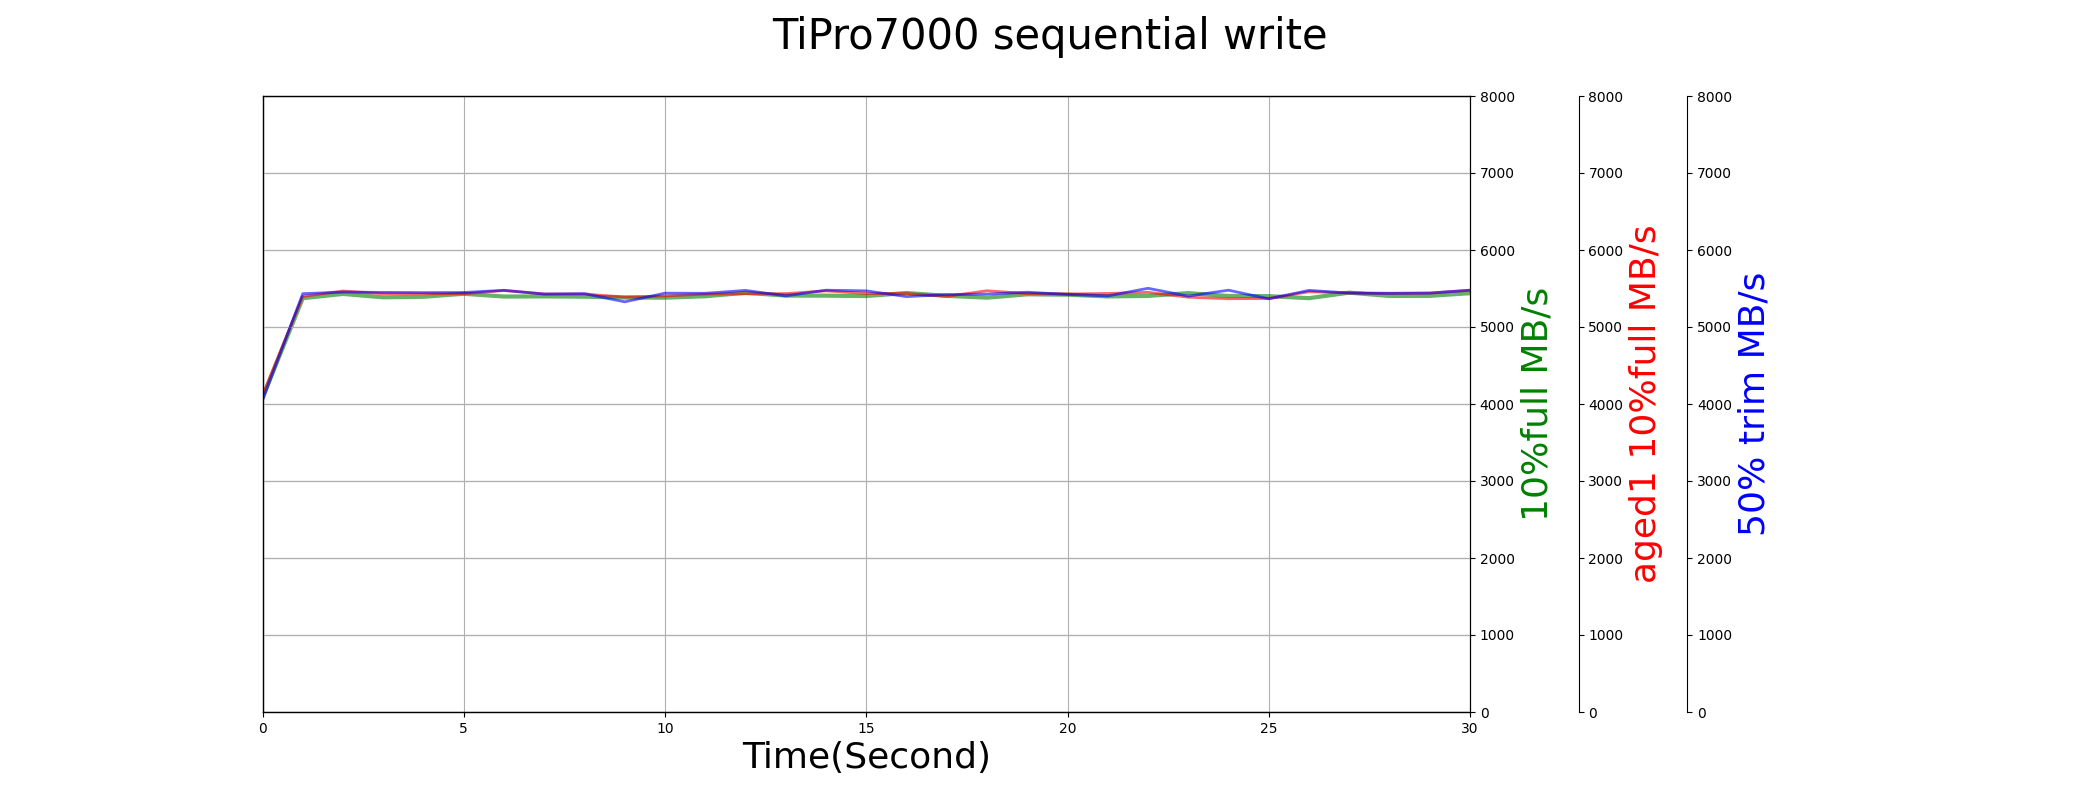
SLC cache retirement
TiPro7000 use the whole capacity as SLC cache. When the drive is young, and utilized space is low, it gives user the highest performance. But when space is occupied, especially when 90% space filled, we can notice a big performance drop in the above test. Furthermore, when the drive is written extensively (e.g. > 2000 P/E used), we can also find that almost the whole SLC cache is retired, and we cannot observe SLC performance at all in that the test diagram below.
Random Write
TiPro7000’s random write performance is not the best, but it is good enough.
| 10% filled (K IOPS) | 50% filled (K IOPS) | 90% filled (K IOPS) | |
|---|---|---|---|
| TiPro7000 | 318.165 | 224.064 | 213.358 |
| 980Pro | 386.622 | 629.517 | 544.405 |
| SN850 | 280.283 | 250.407 | 158.988 |
Trim
Except for read and write, Trim is also a common command in nowadays’ OS. We test its performance by trim half LBA space.
TiPro7000 has very good Trim performance, on both speed and Latency. And the write speed can gain the benefit from Trim, the sequential write performance is increased more than 100% after triming half LBA space.
| IOPS (K) | Average Latency (ms) | performance before trim (MB/s) | performance after trim (MB/s) | |
|---|---|---|---|---|
| TiPro7000 | 11.628 | 1.329 | 1609.822 | 3414.978 |
| 980Pro | 1.676 | 9.535 | 2172.154 | 2938.130 |
| SN850 | 4.184 | 3.804 | 2029.665 | 3225.354 |
Power
If we use SSD in laptop, the power consumption is also a key consideration.
basic data
We list TMT1/2 setting below. TiPro7000’s TMT1/TMT2 setting is much higher than imagination, but I don’t think they use automotive-grade NAND.
| TMT1/degreeC | TMT2/degreeC | |
|---|---|---|
| TiPro7000 | 99 | 109 |
| 980Pro | 81 | 82 |
| SN850 | 80 | 82 |
Low Power State
| PS4 measured power (mW) | PS4 exit duration (us) | PS3 measured power (mW) | PS3 exit duration (us) | |
|---|---|---|---|---|
| TiPro7000 | 9.6 | 44225.1 | 93.9 | 8194.0 |
| 980Pro | 2043.0 | 408.1 | 2044.1 | 417.2 |
| SN850 | 1333.3 | 164.7 | 1332.1 | 164.1 |
TiPro7000 has the reasonable low power consumption of PS4 and PS3. And its exit duration is well controlled. However, in our stress low power state transition test (saw_diagram.py), TiPro7000 failed to exit from PS3 and the drive is lost!
Active Power Consumption
Sequential Write
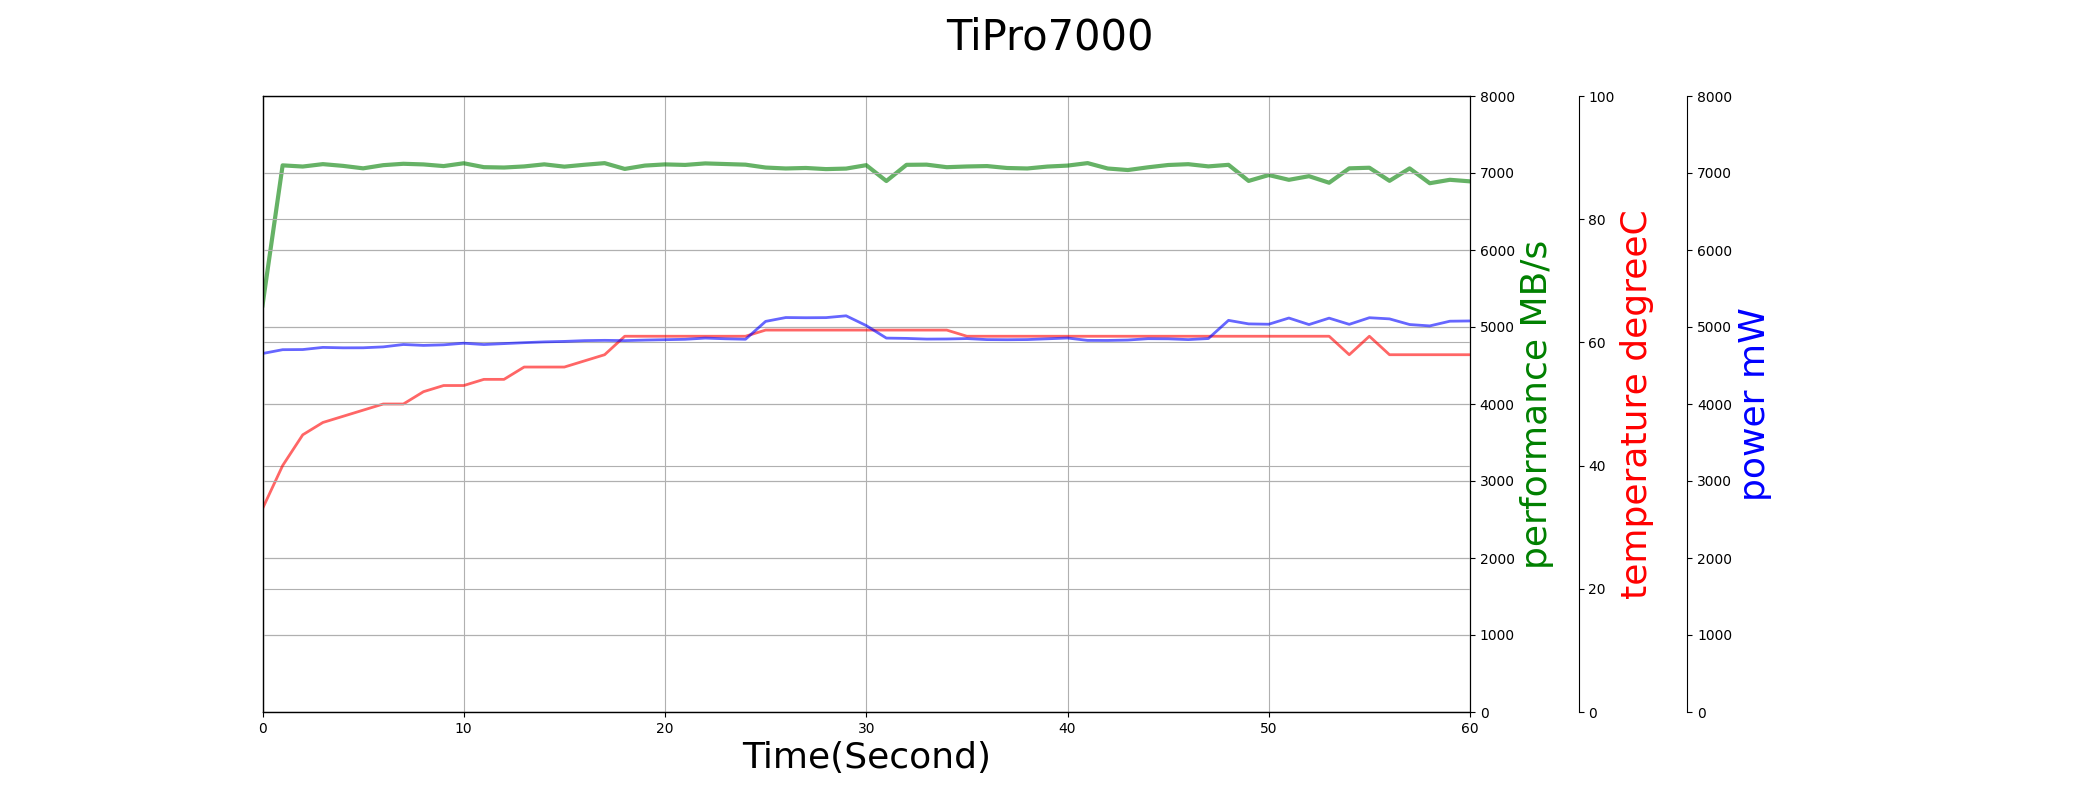
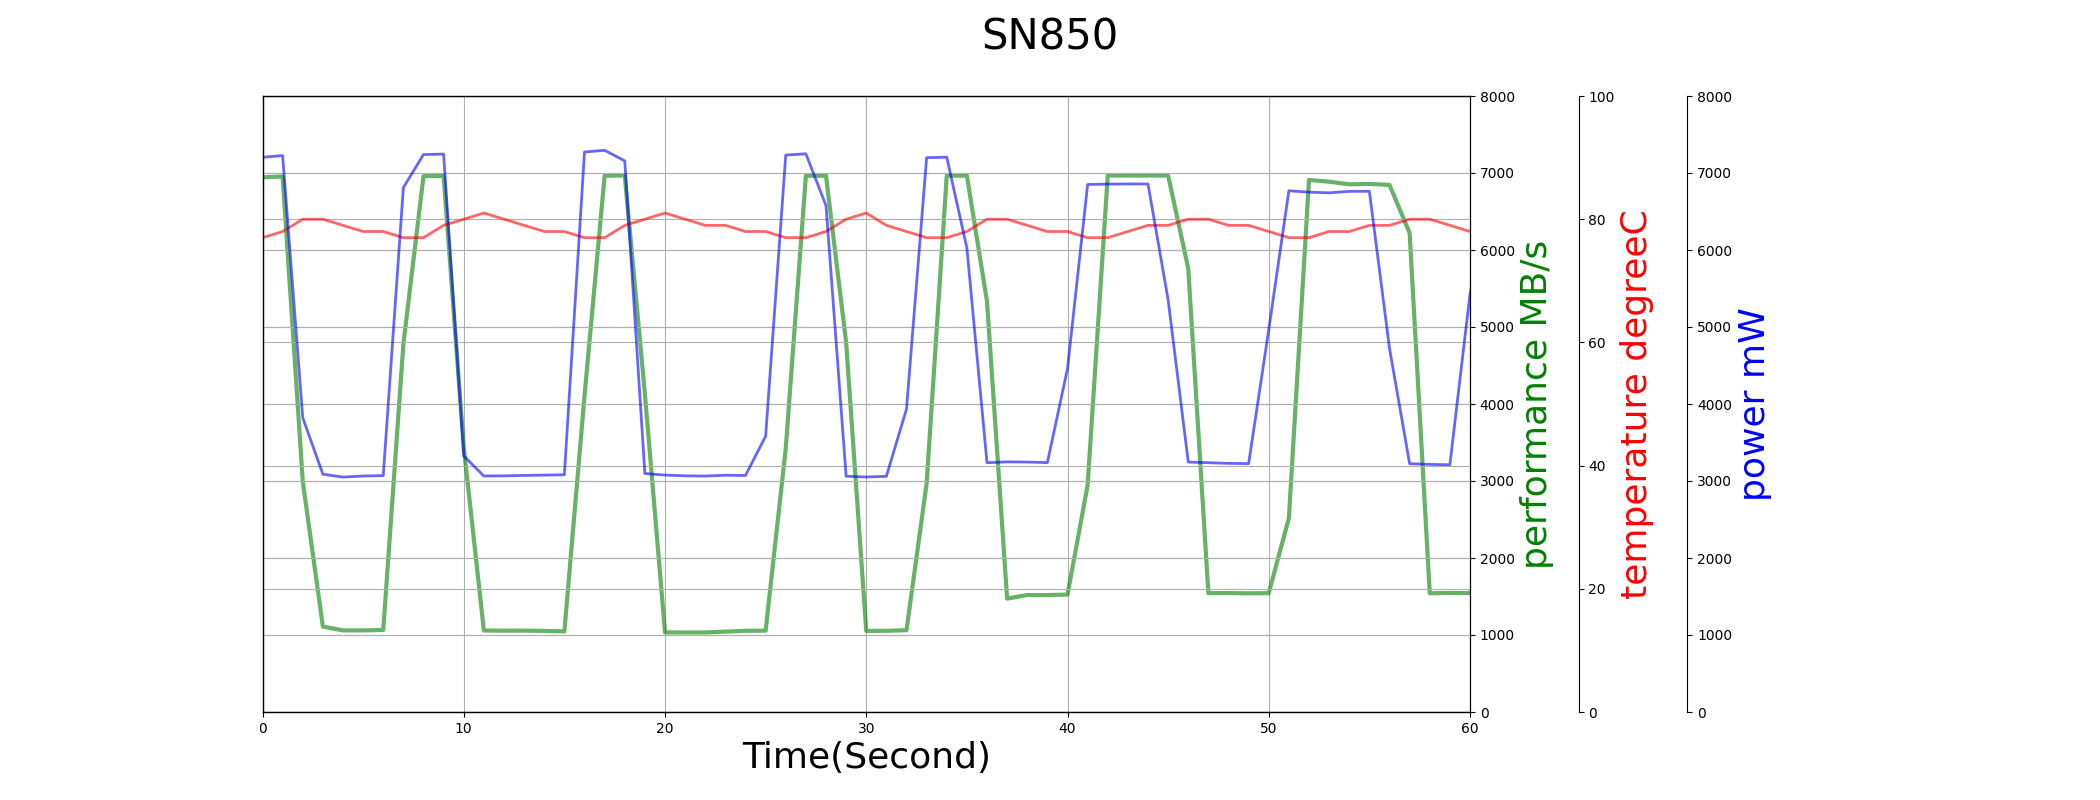
We compare the performance and power consumption of TiPro7000 and SN850 in sequential write test below.
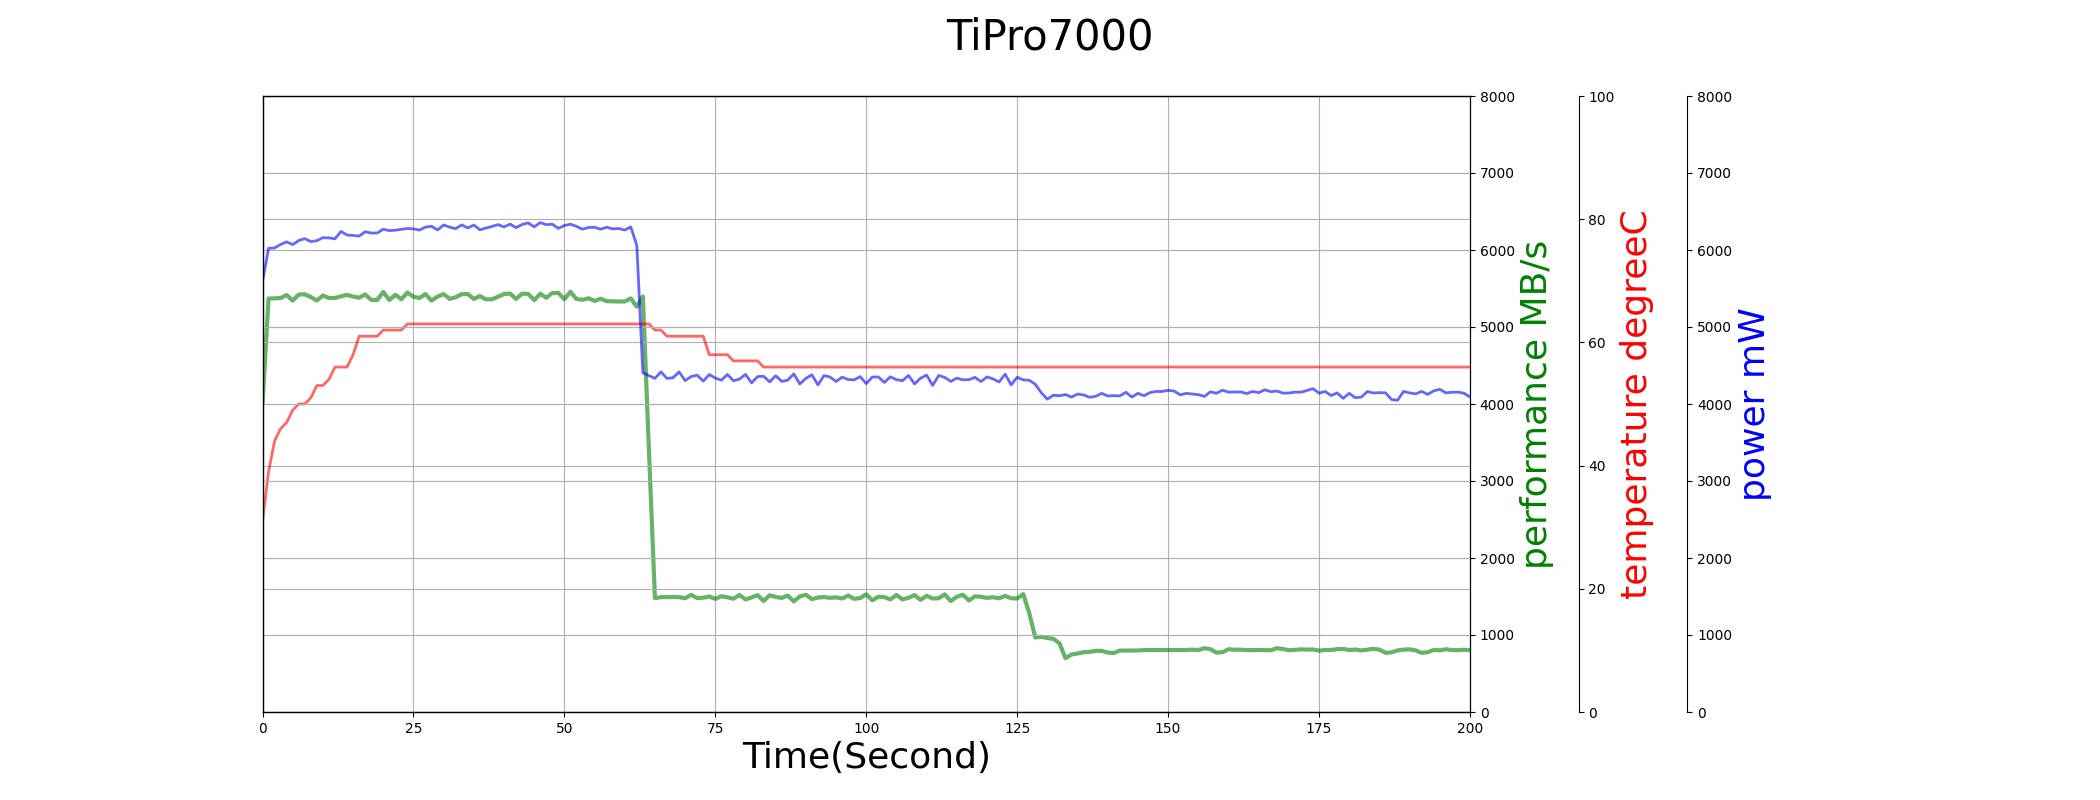
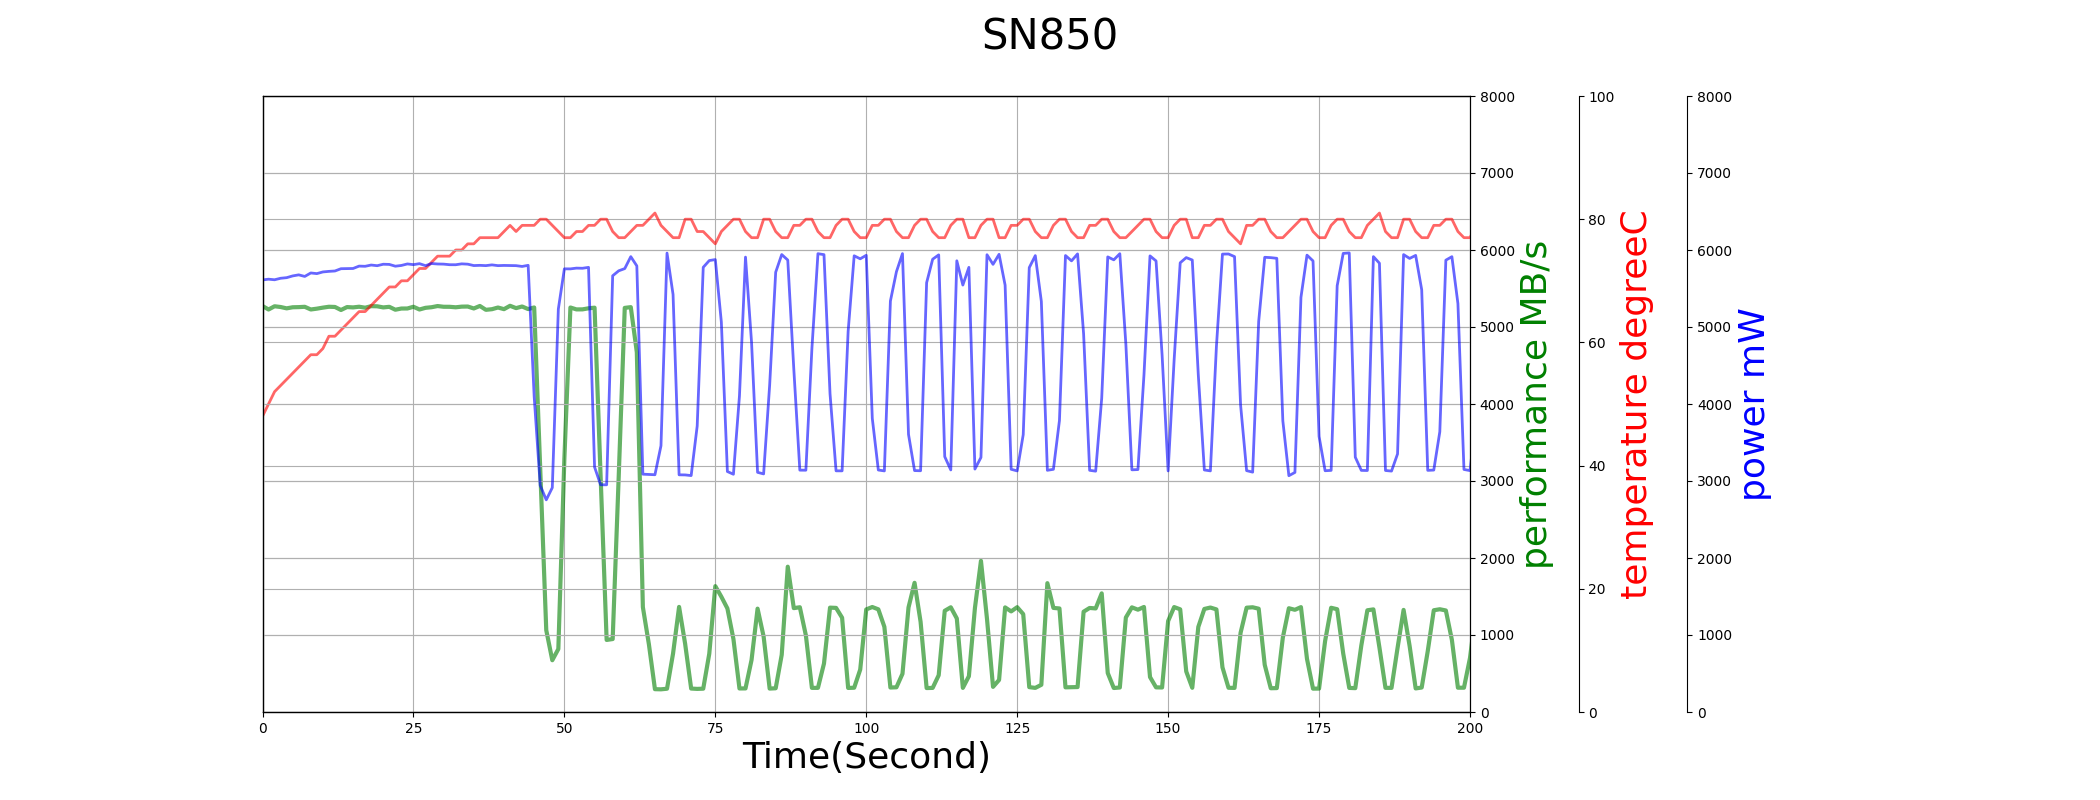
Both TiPro7000 and SN850 use the full capacity as SLC cache, so their SLC performance can last longer, around 60-second. Though their max power consumption are similar, SN850’s temperature is much higher. So SN850 starts thermal throttling earlier even when SLC cache is not used up, and TiPro7000 has a much better performance consistency in the whole duration of the test.
Sequential Read
TiPro7000 has a better sequential read performance due to lower power consumption and temperature. But we can notice the time-0 performance problem again.
Reliability
Data Retention
In our whole test process, we will write each DUT to its EOL (about 3000 P/E cycle for TLC SSD), then write the whole drive and keep them without power at the room temperature for 2 month. After that, we read the whole drive and verify its data integrity. Here is the test result.
| Data Units Written (1000LBA) | read speed 0 (MB/s) | read speed 2 (MB/s) | |
|---|---|---|---|
| TiPro7000 | 4735478410 | 5928 | UECC |
| 980Pro | 5542172462 | 6177 | 6345 |
| SN850 | 7506783940 | 4941 | 188 |
‘read speed 0’ is captured right after the data was written, and ‘read speed 0’ is captured 2-month later. SN850 was written by much more data intentionally. We check the result of ‘read speed 2’.
TiPro7000 reports many UECC data, so its test fails. 980Pro test passes with normal speed, even though it has more data written than TiPro7000. Due to the greater data written quantity, SN850 suffers from NAND raw data quality issue, but it still can pass the test. Even though the performance is ultra-low (188MB/s), all data can be recovered finally.
UECC simply means data lost.