KIOXIA EXCERIA PLUS G4 1TB | Test Report
Test Platform
| Item | Test configuration |
|---|---|
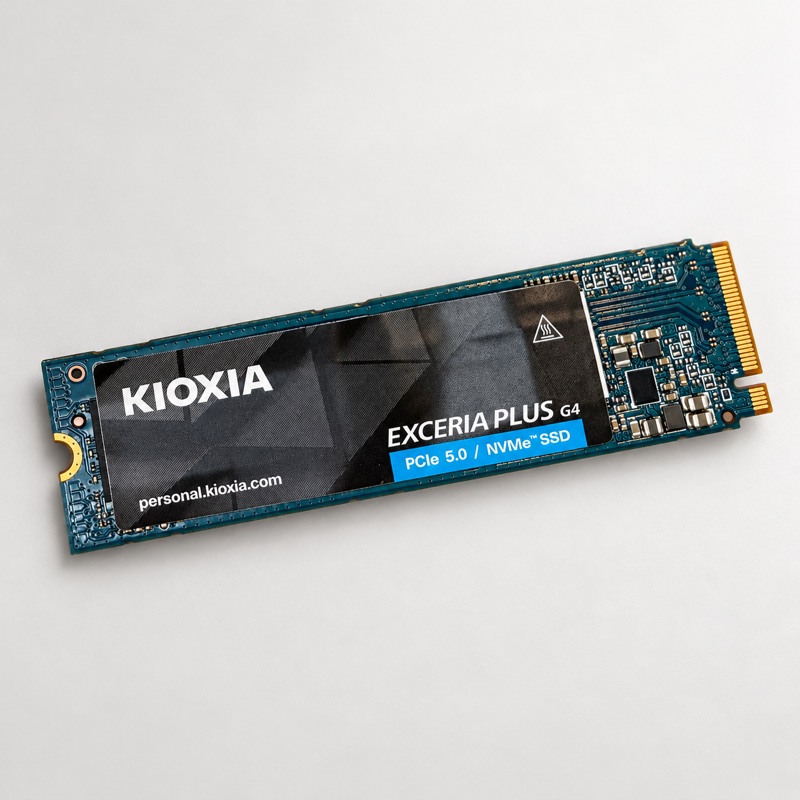
| Drive | KIOXIA EXCERIA PLUS G4 1TB; M.2 2280, PCIe Gen5 ×4; manufacturer-stated TLC NAND |
| Sample | One sample; serial number YEFKF30QZ23M |
| Firmware | EVFAJ1.0 |
| Platform | NUC, Core Ultra 9 285H, 16 GB RAM; Ubuntu 26.04.1, Linux 7.0.0-34 |
| Tools | PyNVMe3 26.11; Quarch PPM for power measurement |
| PCIe Link | 32 GT/s ×4 |
| HMB | 64 MB |
Test Procedure
PyNVMe3 was used to test protocol, performance, power, stress, power cycling, and model reading.
| Category | Test ID | Scope |
|---|---|---|
| Protocol and reset | TP1 | Applicable management, I/O, HMB, reset, power management, register and security functions; some features were skipped according to capability. |
| Low-power states | TP2.a | Power consumption and read/write response in low-power states. |
| Performance and power | TP2.b | Sequential, random and mixed I/O performance, response time and supply power at different write-workflow checkpoints. |
| Stress and data verification | TP2.c | 110 combined stress cycles followed by full-drive readback verification. |
| Sudden power loss and recovery | TP2.d | 100 sudden power-loss cycles under random I/O, with recovery timing and data verification. |
| Normal power cycles | TP2.e | 100 normal shutdown and power cycles, with recovery-to-access timing. |
| Advertised performance | TP2.f | Peak sequential and random read/write performance in a small region. |
| Link speed switching | TP2.g | Fixed Gen5 and dynamic Gen2–Gen5 link-speed changes under a read workload. |
| Model loading | TP2.h | Read synthetic images of different sizes at various queue counts and queue depths. |
Product Radar
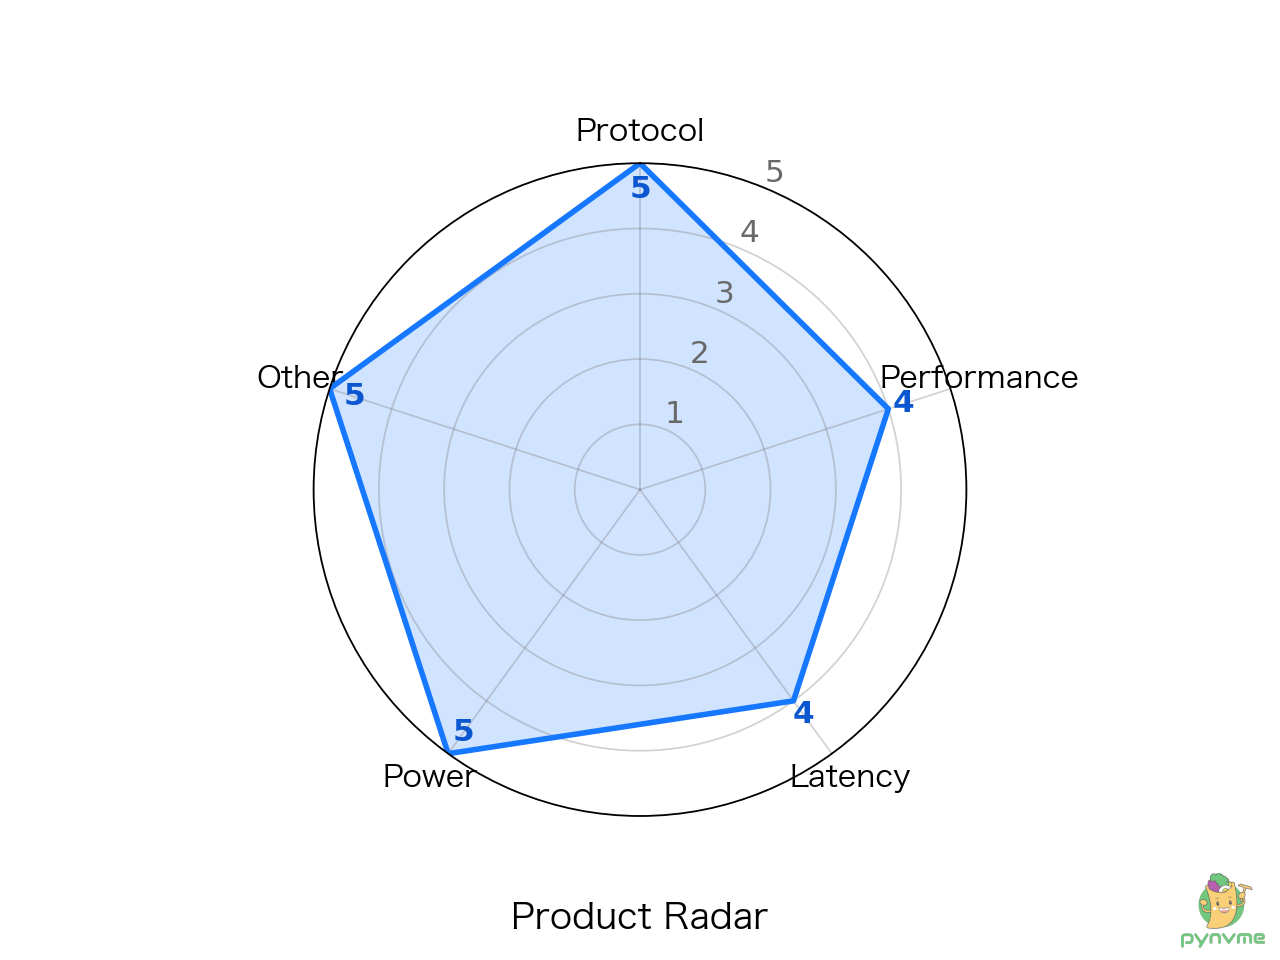
This chart shows five aspects of the tested sample. Protocol covers functions related to NVMe and PCIe specifications; performance covers read and write capability; latency concerns response time; power covers electricity consumption; and other includes stress, power cycling and recovery. Each dimension is scored from 1 to 5, with a higher score farther from the center.
Performance Positioning
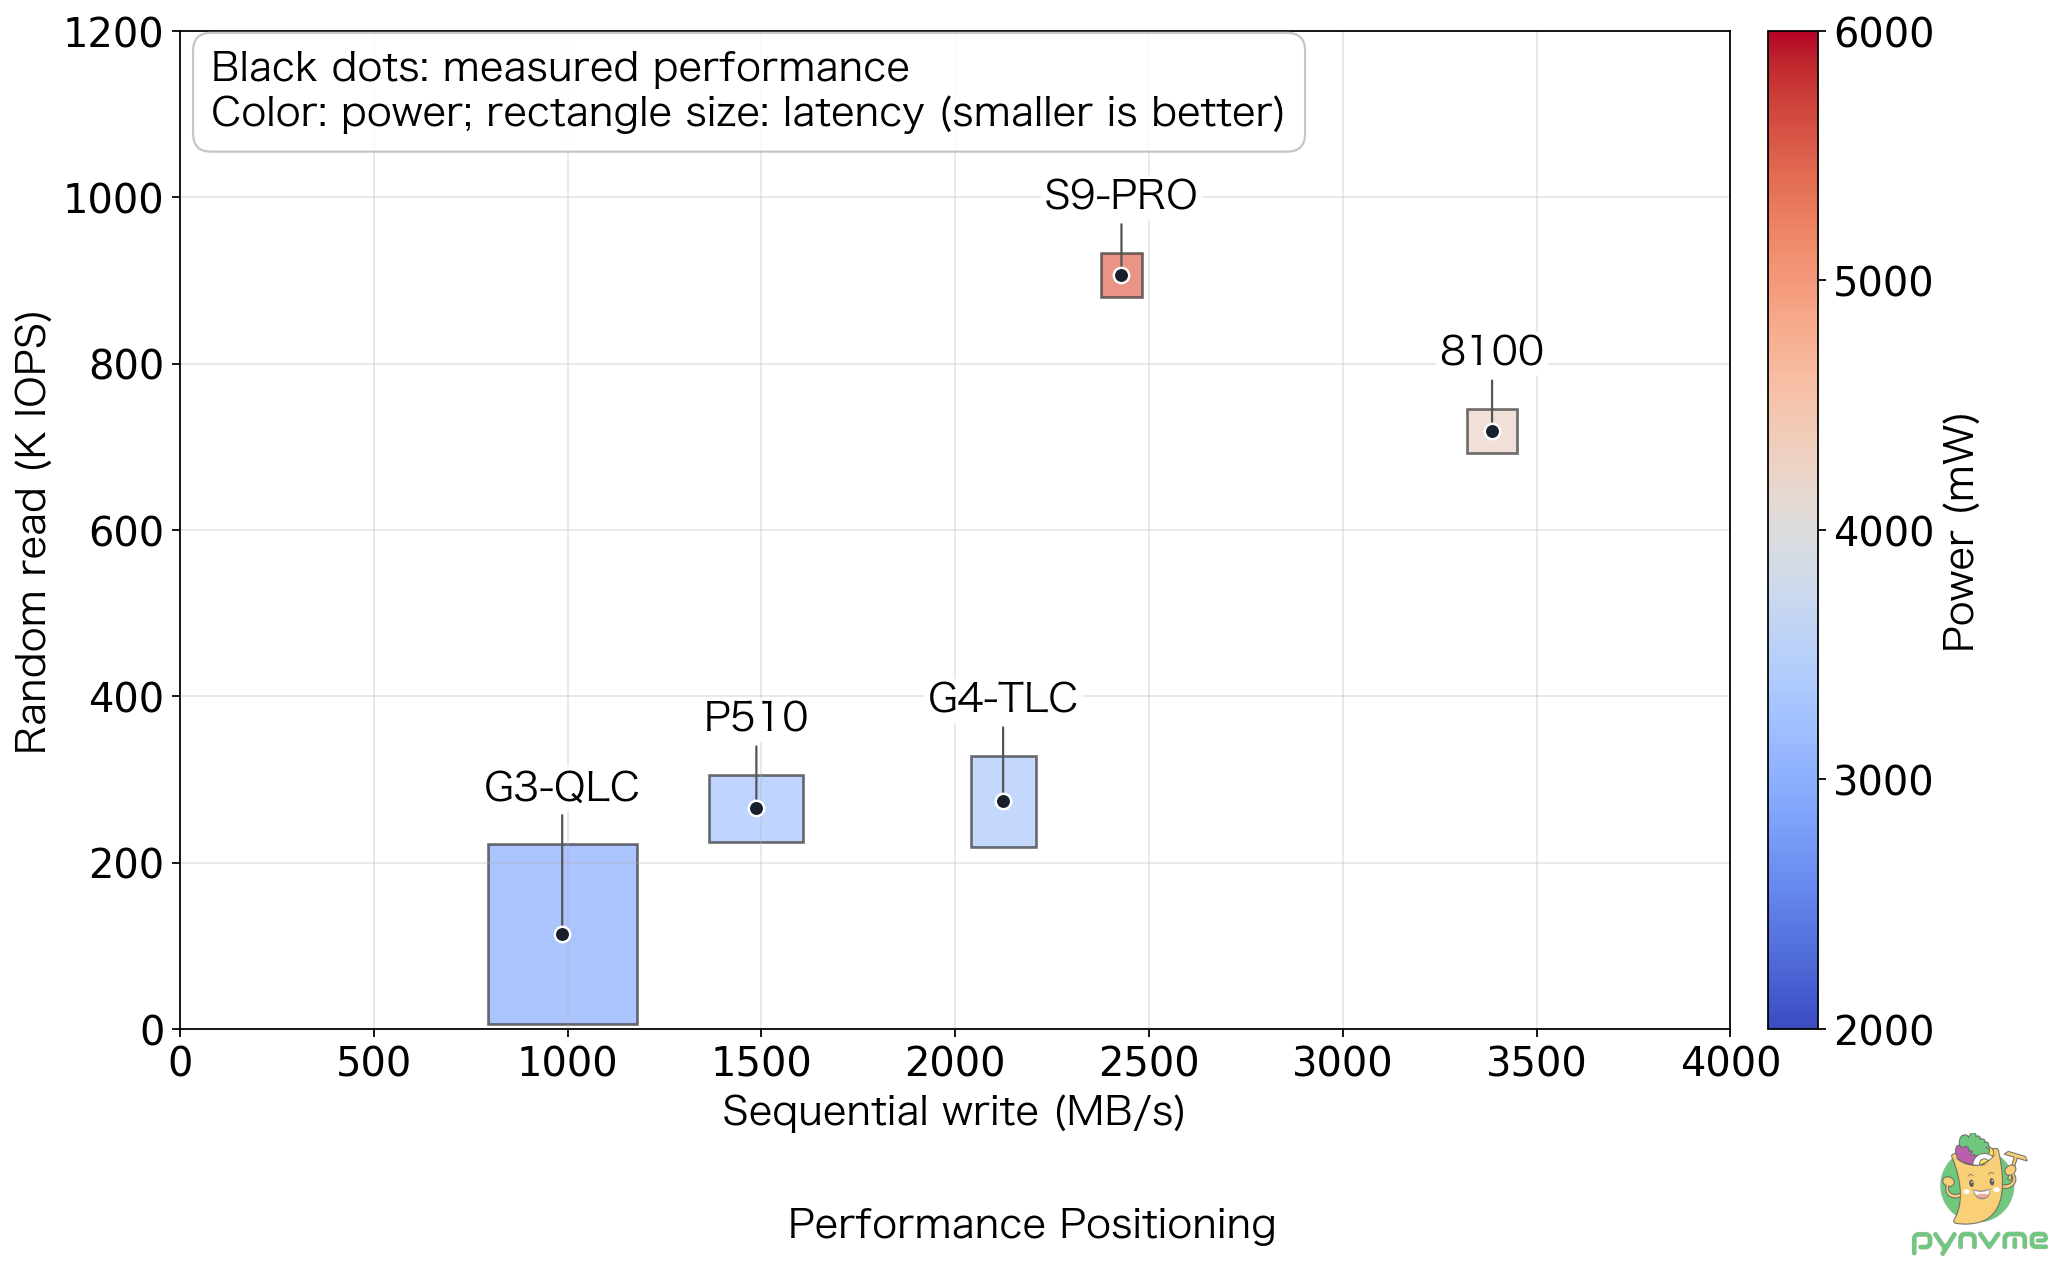
Each black dot places one drive according to two tests. Farther right means higher sequential write speed; higher up means stronger random read performance. The width and height of the rectangle represent longer response times in two workloads. Color represents power consumption during testing: blue is lower and red is higher.
Model Loading Time
This test simulates reading model images from an SSD and compares loading times at different queue counts and queue depths.
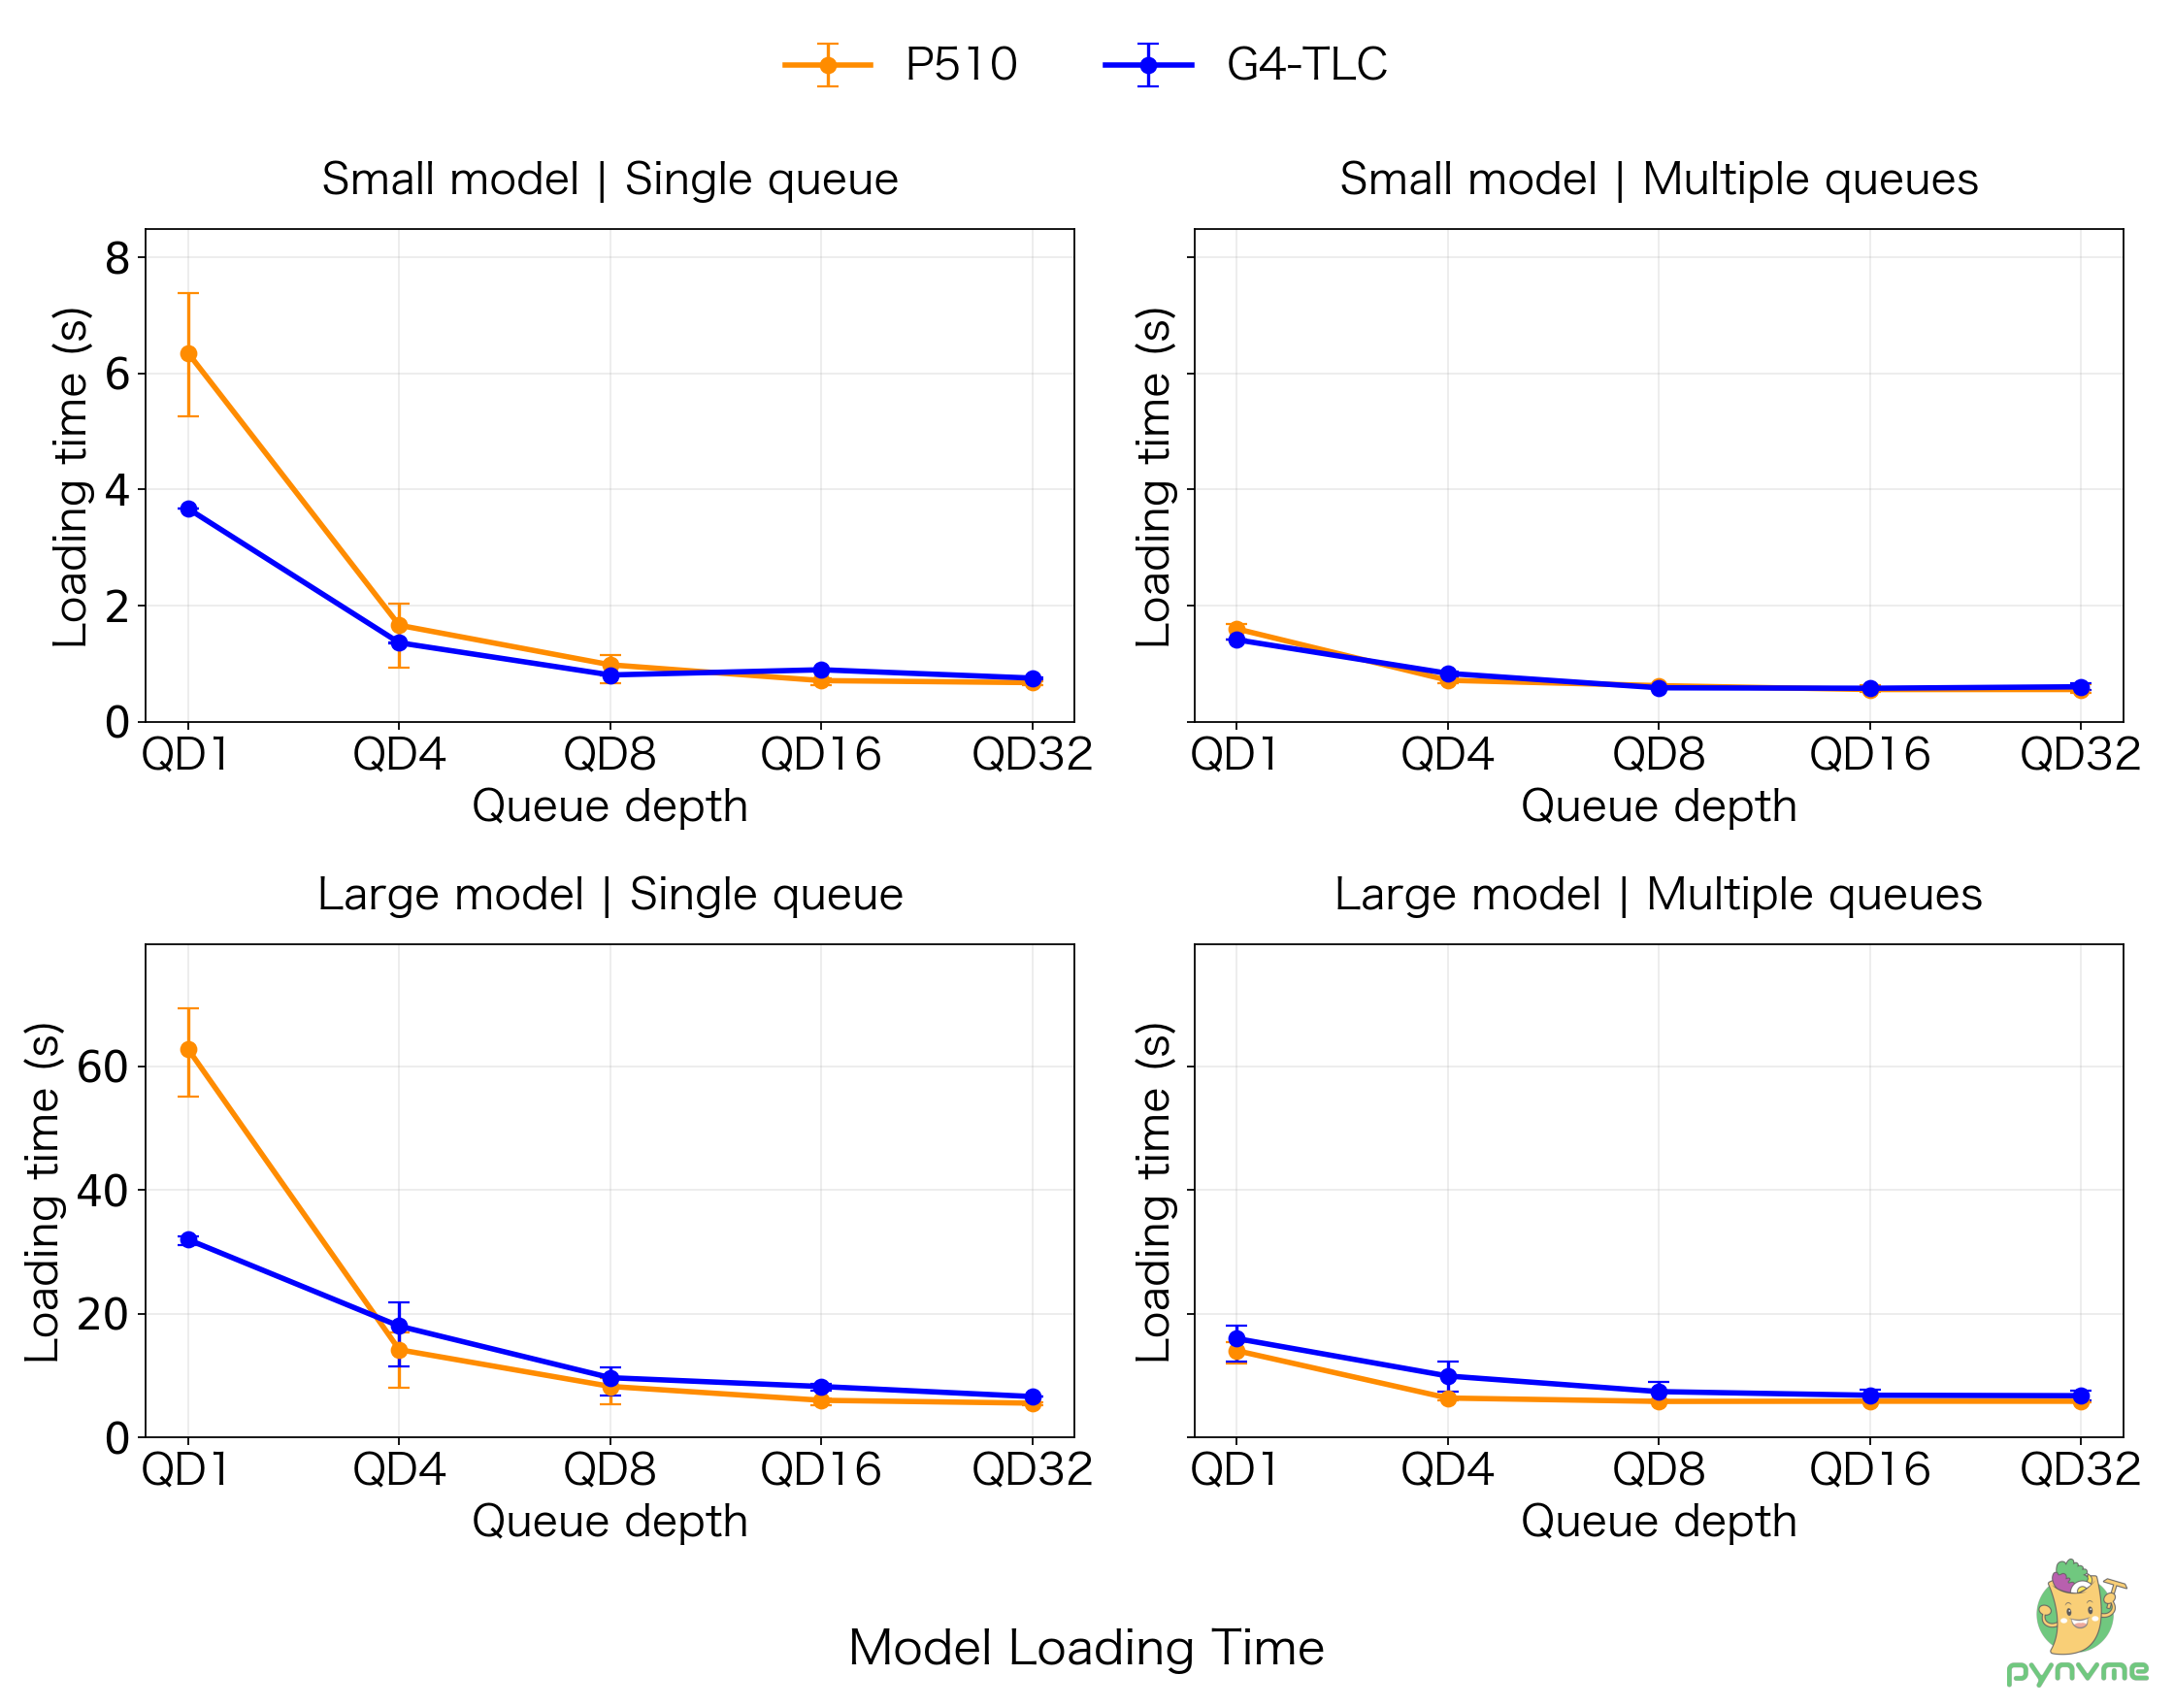
The four panels show small (4.7 GiB) and large (40 GiB) model images, each with a single queue and multiple queues. Queue depth on the horizontal axis is the number of read requests that each queue can issue at the same time; the vertical axis shows average read time. A lower line means the read completed sooner under those test conditions. Each point summarizes multiple measurements; the vertical bars show the observed range.
Key Issues
| ID | Test ID | Description |
|---|---|---|
| G4-01 | TP2.b | During concurrent sequential writes and mixed reads/writes, some I/O operations took more than one second. The commands ultimately completed successfully; the cause has not been established. |