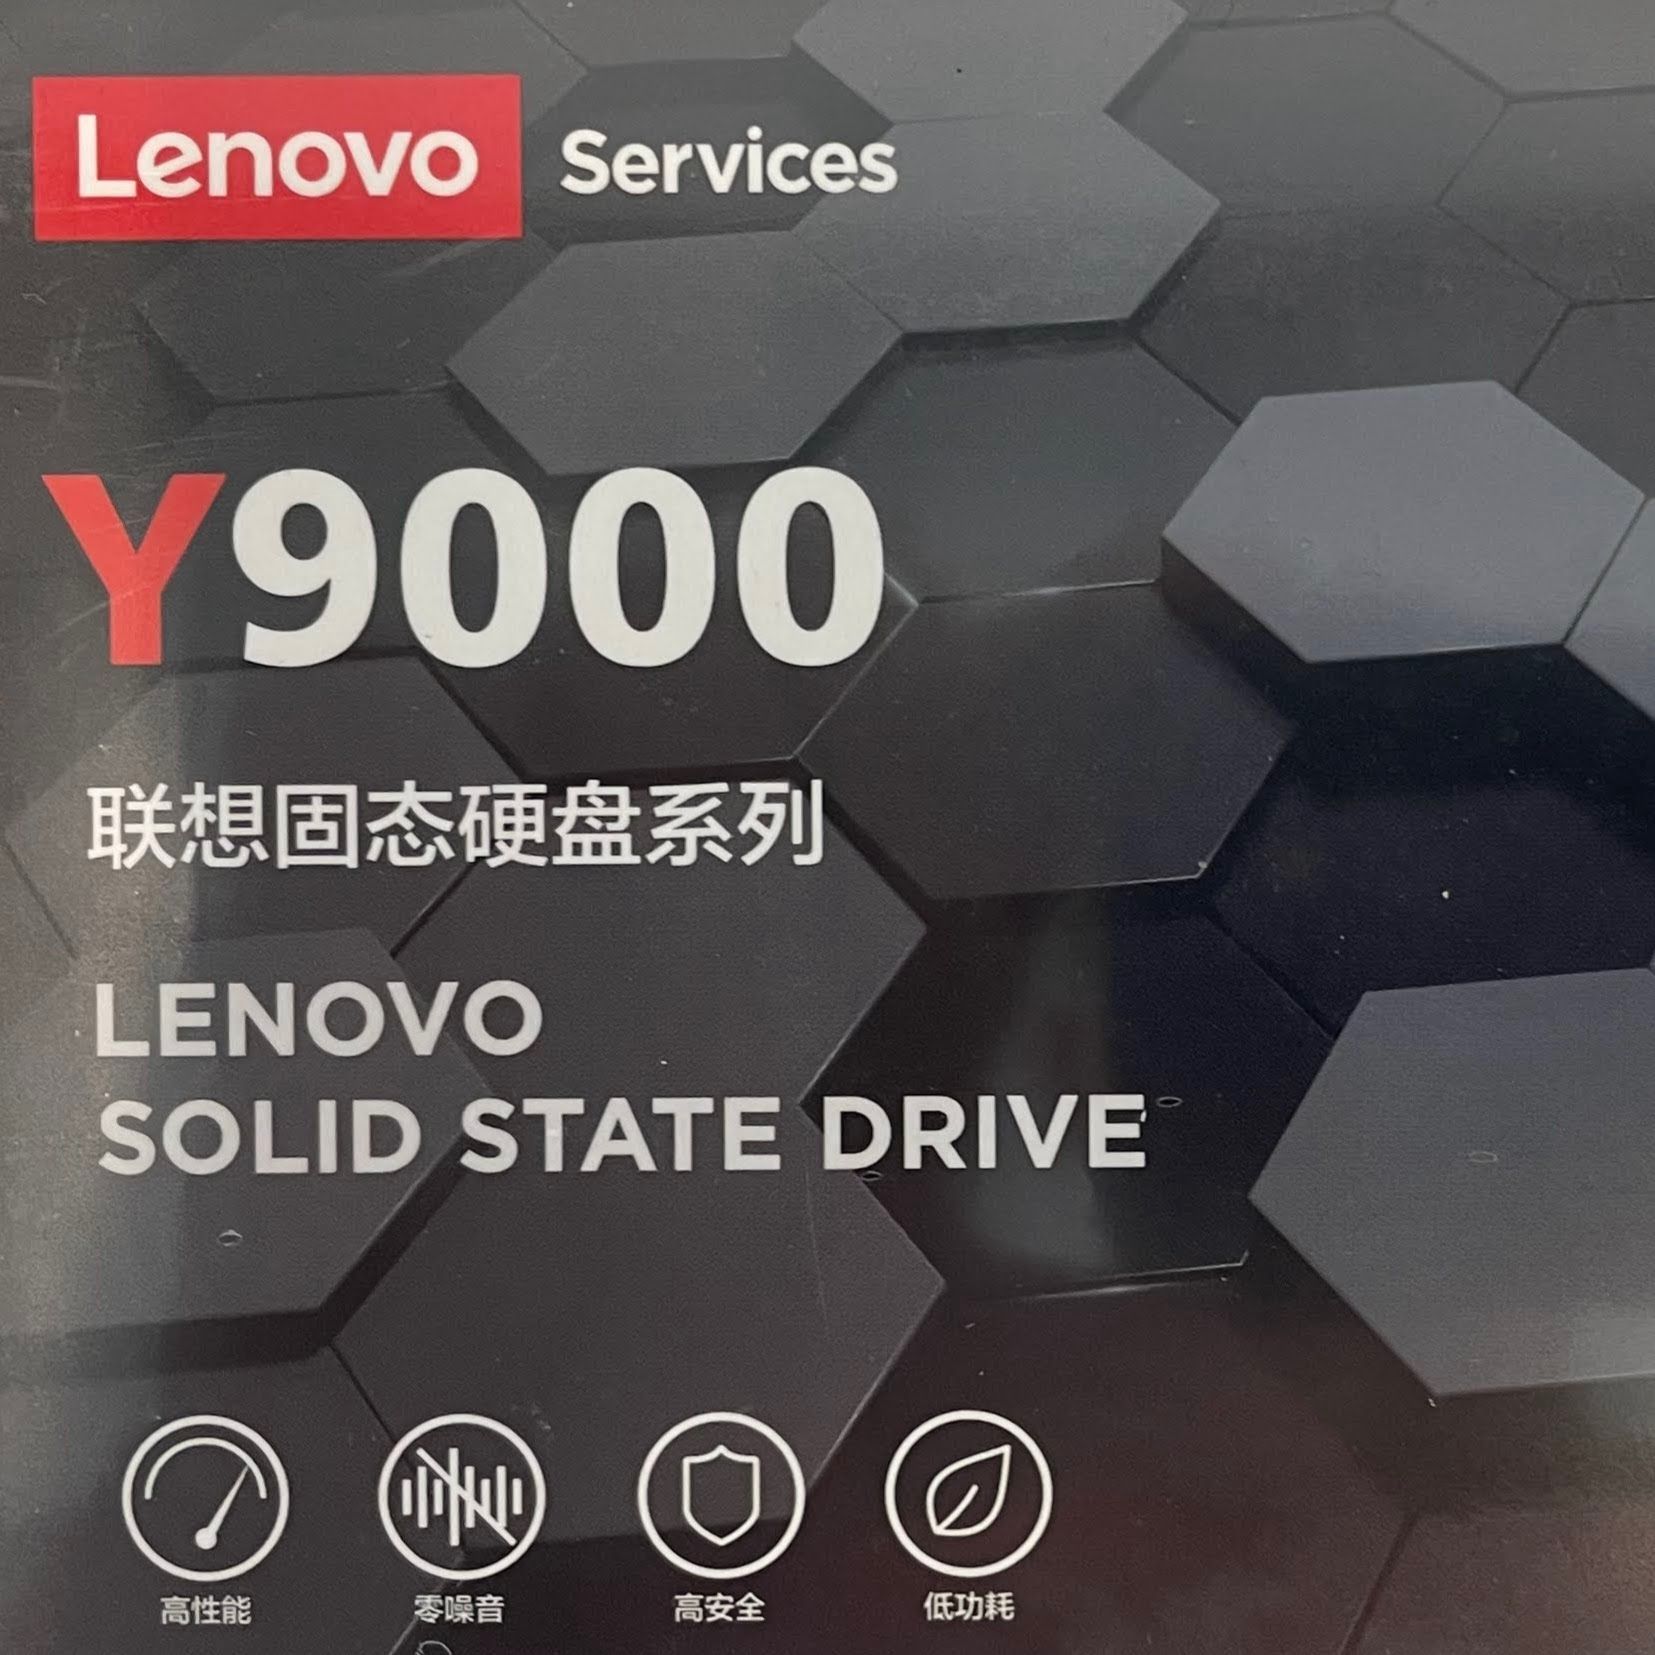
Lenovo Y9000 1TB
Basic Information
In this report, we compare Lenovo’s Y9000 with 980Pro and SN850 from Samsung and WD respectively. They are all designed for high-end Client market, like gaming PC.
| Model Name | Firmware Version | |
|---|---|---|
| Y9000 | Lenovo Y9000 SSD-M.2-2280s-NVMe-1T | EIFM31.4 |
| 980Pro | Samsung SSD 980 PRO 1TB | 5B2QGXA7 |
| SN850 | WDS100T1X0E-00AFY0 | 614900WD |
Latency
First of all, let’s check their latency. We believe Latency is overlooked in many SSD evaluations.
Max Write Latency
| 10 IOPS (ms) | 512B 1QD 10p filled (ms) | RW mixed with trim (ms) | |
|---|---|---|---|
| Y9000 | 220.782 | 8.514 | 278.917 |
| 980Pro | 8.616 | 8.462 | 113.652 |
| SN850 | 0.287 | 6.555 | 15.846 |
In light workload, e.g. fixed writing 10 IO per second, Y9000’s max latency is very high. It means users may notice the delay occassionally. When workload is heavier, this symptom disappears. But it happens again when Trim commands are mixed into read/write IO.
After fill the whole drive, and when filling the drive for the second time. We can find that their average latency and IOPS are very near, but the max latency of Y9000 and SN850 are very high, even higher than 1 second. It would lead to annoying delay in user’s experience.
| Max Latency (ms) | Average Latency (ms) | IOPS (K) | |
|---|---|---|---|
| Y9000 | 1060.769 | 5.262 | 12.113 |
| 980Pro | 105.543 | 5.035 | 12.634 |
| SN850 | 1158.337 | 6.322 | 10.067 |
Speed
SSD can handle read/write IO in an optimized performance. We can find all 3 drives have good and similar performance.
Sequential Write
| 10% filled (MB/s) | 50% trimmed (MB/s) | |
|---|---|---|
| Y9000 | 4217.862 | 3431.828 |
| 980Pro | 3065.800 | 2938.130 |
| SN850 | 4833.883 | 3225.354 |
From the table above, Y9000’s sequential write performance is good when only 10% drive space is filled. After full-fill the drive, and trim half of them, the performance of Y9000 is recovered and still very good.
But from the diagram below, we can find a problem that Y9000’s time 0 performance is very low. The drive seems be kicked off later than others.


Random Write
| 10% filled (K IOPS) | 50% filled (K IOPS) | 90% filled (K IOPS) | |
|---|---|---|---|
| Y9000 | 296.407 | 231.600 | 195.651 |
| 980Pro | 386.622 | 629.517 | 544.405 |
| SN850 | 280.283 | 250.407 | 158.988 |
Trim
Except for read and write, Trim is also a common command in nowadays’ OS. We test its performance by trim half LBA space.
Y9000, as well as 980Pro, has bad trim performance. Furthermore, Y9000 still has max latency issue. All 3 drives can benifit performance from Trim commands.
| IOPS (K) | Max Latency (ms) | Average Latency (ms) | performance before trim (MB/s) | performance after trim (MB/s) | |
|---|---|---|---|---|---|
| Y9000 | 1.703 | 1036.134 | 9.382 | 1674.617 | 3431.828 |
| 980Pro | 1.676 | 58.529 | 9.535 | 2172.154 | 2938.130 |
| SN850 | 4.184 | 13.649 | 3.804 | 2029.665 | 3225.354 |
Power
If we use SSD in laptop, the power consumption is also a key consideration. We list TMT1/2 setting below.
| TMT1 (℃) | TMT2 (℃) | |
|---|---|---|
| Y9000 | 75 | 78 |
| 980Pro | 81 | 82 |
| SN850 | 80 | 82 |
Low Power State
| PS4 measured power (mW) | PS4 exit duration (us) | PS3 measured power (mW) | PS3 exit duration (us) | |
|---|---|---|---|---|
| Y9000 | 2.7 | 155604.6 | 45.2 | 155162.6 |
| 980Pro | 2043.0 | 408.1 | 2044.1 | 417.2 |
| SN850 | 1333.3 | 164.7 | 1332.1 | 164.1 |
Y9000 consumes ultra-low power in both PS3 and PS4. It is great. But we can also notice the ultra-high exit duration. In the above latency test result, we find that Y9000 has high max latency in light workload IO test. It may be just caused by the long exit duration. People may notice the delay[1].
Active Power Consumption
We compare the performance and power consumption of Y9000 and 980Pro in sequential write test below.


Y9000 and 980Pro have similar performance in the first 60-second. But after that, due to thermal throttling, 980Pro limits its performance. Y9000’s thermal efficiency makes its longterm performance better.
However, if we extend the above Y9000 diagram to 200 seconds, something bad appears. When Y9000 starts thermal throttling, its performance can drop to ZERO. But actually, the SMART temperature is only 75℃, which is TMT1, at that time. The drive should serve IO with a limited performance when its temperature is between TMT1 and TMT2, instead of cutting the performance to zero. Again, it is bad for user’s experience. And here is another question? Is the temperature data in SMART accurate?

